echarts3.0 儀表盤例項更改完成佔用率例項
阿新 • • 發佈:2019-01-07
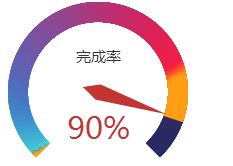
需要完成的專案效果

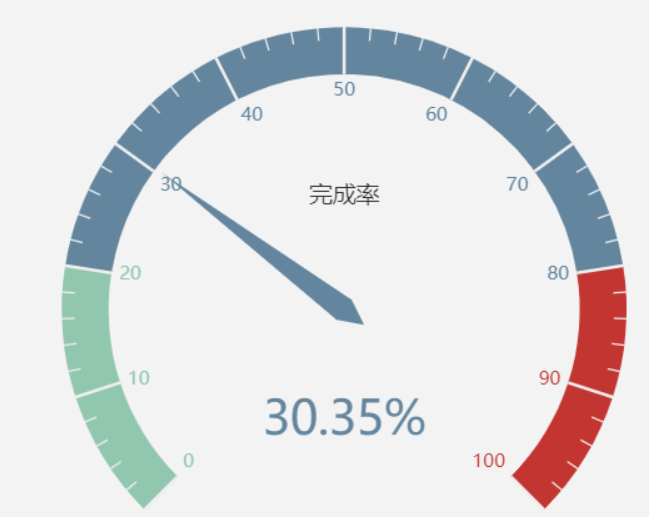
官方例項效果

基本思路:
首先引入jquery和echarts3.0庫。
需要兩個儀表盤,一個儀表盤是純色灰色,在底部。startAngle 和endAngle永遠是最大值,預設為225到-45。
另外一個儀表盤漸變色,在上面,此儀表盤不需要指標,value值永遠是100。startAngle 是起點位置,預設為225。因此只需要控制endAngle的位置,就可以了。
程式碼如下:
<!DOCTYPE html>
<html lang="en">
<head>
	<meta charset="UTF-8">
	<title>銀聯行業代付平臺數據監控</title>
	<script src="./jquery.js"></script>
</head>
<body>
	<div id="wrap">
		<div id="main" style="width: 240px;height:240px;"></div>
		<div><img id="linear-pic" style="display: none;" src="./jb.png" alt=""></div>
		<div id="main2" style="width: 240px;height:240px;"></div>
		<div><img id="linear-pic2" style="display: none;" src="./jb.jpg" alt=""></div>
	</div>
	<style>
		#wrap{
			width: 240px;height: 240px;
			position: relative;
		}
		#wrap div{width: 100%;height: 100%;}
		#wrap #main,#wrap #main2{position: absolute;top: 0;left: 0;;}
		#wrap #main{z-index:2}
		#wrap #main2{z-index:1}
	</style>
</body>
<script src="./echarts.min.js"></script>
<script>
	M(90);
	function M(val){
		var startAngle = 225;
		var endAngle = -45;
		var end = 0;
		var L = (startAngle - endAngle)/100;
		end = startAngle - val*L;

		function option(obj){
			var series = {
				name: '業務指標',
				type: 'gauge',
				splitNumber: 1,
				startAngle: obj.startAngle,
				endAngle: obj.endAngle,
				title:{
					show:obj.titleShow
				},
				axisLine: {
					lineStyle: {
						width: 20,
						// 透明度設定為0
						opacity: 0
					}
				},
				splitLine: {
					show: false
				},
				axisTick: {
					length: 20,
					splitNumber: 300,
					lineStyle: {
						color: {
							image: obj.image,
							repeat: 'no-repeat'
						},
						width: 5
					}

				},
				axisLabel:{show:obj.axisLabelShow},
				// 指標樣式
				itemStyle: {},
				detail: {show:obj.deTailShow,formatter:'{value}%'},
				data: [{value: obj.value, name: '完成率'}]
			};
			if(obj.pointer===false){
				series.pointer = false;
			}
			return  {
				tooltip : {
					formatter: "{a} <br/>{b} : {c}%"
				},
				toolbox: {
					feature: {
						restore: {},
						saveAsImage: {}
					}
				},
				series:  [series]
			}
		};
		echarts.init(document.getElementById('main'))
		.setOption(option({
			startAngle:startAngle,
			endAngle:end,
			deTailShow:false,
			axisLabelShow:false,
			titleShow:true,
			value:100,
			image:document.getElementById('linear-pic')
		}), true);

		echarts.init(document.getElementById('main2'))
		.setOption(option({
			startAngle:startAngle,
			endAngle:endAngle,
			deTailShow:true,
			axisLabelShow:false,
			titleShow:false,
			value:val,
			pointer:false,
			image:document.getElementById('linear-pic2')
		}), true);
	}
</script>
</html>
