Win7,64位下Python讀取Excel檔案並繪製圖表
阿新 • • 發佈:2019-01-08
1、安裝xlrd的whl檔案:
Python讀取Excel使用xlrd,到官網https://pypi.python.org/pypi/xlrd下載xlrd-1.0.0-py3-none-any.whl安裝。
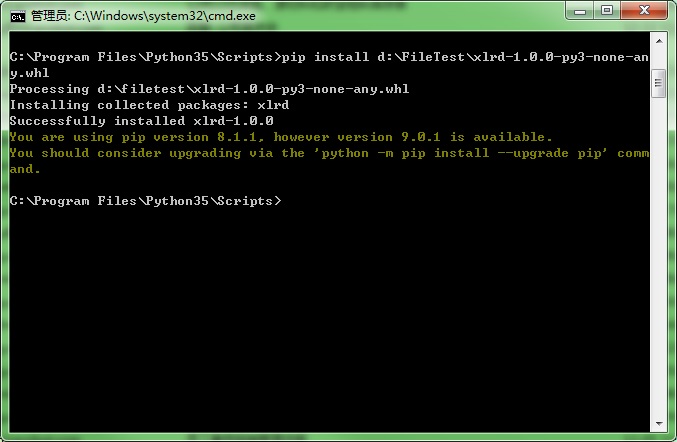
在C:\Program Files\Python35\Scripts目錄下,執行pip命令,檔名寫全路徑
pip install D:\FileTest\xlrd-1.0.0-py3-none-any.whl
2、Python讀取Excel檔案並繪製圖表
程式碼如下:
#coding=utf-8
#######################################################
#filename:xlrd_draw.py
#author:
#date:xxxx-xx-xx
#function:讀excel檔案中的資料
#######################################################
import numpy as np
import matplotlib.pyplot as plt
import xlrd

#開啟一個workbook
workbook = xlrd.open_workbook('D:\\FileTest\\Barometer.xlsx')

#抓取所有sheet頁的名稱
worksheets = workbook.sheet_names()
print('worksheets is %s' %worksheets)

#定位到mySheet
mySheet = workbook.sheet_by_name(u'Pressure')

#get datas
pressure = mySheet.col_values(0)
#time = mySheet.col(1)
#time = [x.value for x in time]


#drop the 1st line of the data, which is the name of the data.
pressure.pop(0)
#time.pop(0)

#declare a figure object to plot
fig = plt.figure(1)

#plot pressure
plt.plot(pressure)

plt.title('Barometer')
plt.ylabel('Pa')
#plt.xticks(range(len(time)),time)
plt.show()
程式碼下載:
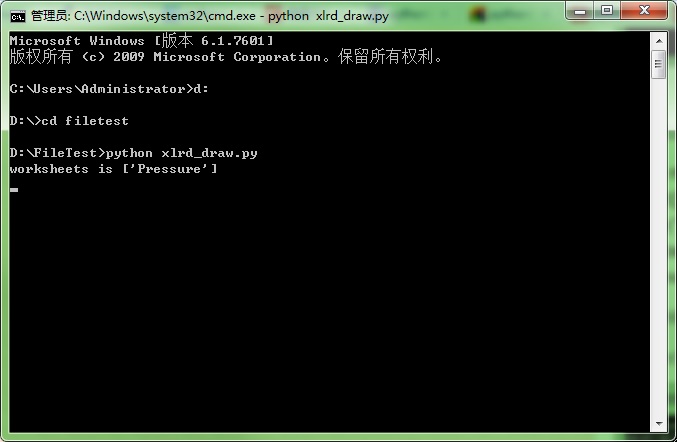
在xlrd_draw.py檔案所在目錄中,執行命令 python xlrd_draw.py
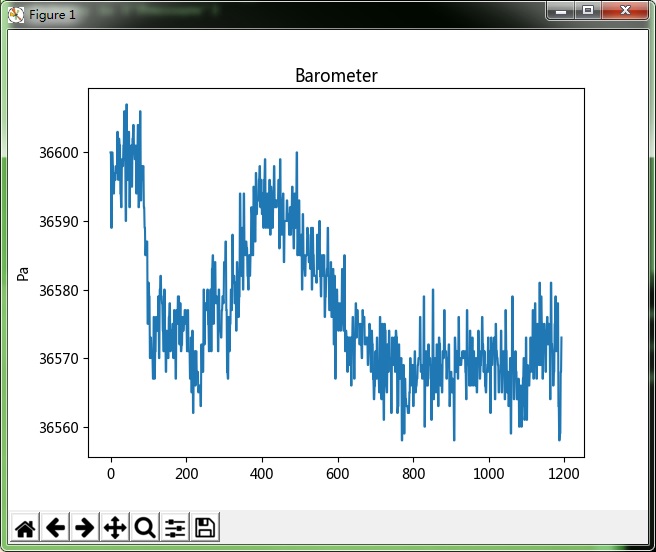
結果如下:


