js 輸出html的表格資料到 excel
阿新 • • 發佈:2019-01-08
測試頁面
<!doctype html>
<!DOCTYPE html>
<html>
<head>
<meta charset="utf-8">
<title></title>
<script src="http://libs.baidu.com/jquery/1.9.0/jquery.js" type="text/javascript"></script>
</head>
<body>
<h1>tableToExcel Demo</h1 excel_tool.js 根據你的資料構建表單,新增到文件樹中但是不顯示
不同的情況,需要自己編寫定製,但大體框架一樣
/*

月份:data : ['1月','2月','3月','4月','5月','6月','7月','8月','9月','10月','11月','12月']
legend 各項指標
分析 series[] 中各項的資料是按照 index = 月份 -1 排列好的資料
{
    name:'蒸發量',
    type:'bar',
    itemStyle: {normal: {color:'rgba(193,35,43,1)', label:{show:true}}},

    第一項:蒸發量
    data:[2.0, 4.9, 7.0, 23.2, 25.6, 76.7, 135.6, 162.2, 32.6, 20.0, 6.4, 3.3]
    第二項:降水量
    data:[2.6, 5.9, 9.0, 26.4, 28.7, 70.7, 175.6, 182.2, 48.7, 18.8, 6.0, 2.3]
    第三項
    data:[6.0, 4.6, 7.0, 23.2, 25.6, 76.7, 135.6, 162.2, 32.6, 26.0, 6.4, 3.3]
},
如果沒有就為空!!!

*/
var excel_tool = {};
/*
target: append to where
*/
excel_tool.buildTable = function(head_data,row_names,content_data,target){
    // 生成表頭
    // var data = legend.data;
    var data = head_data;
    var head_start = "<thead><tr><th>月份</th>";
    var head_end = "</tr></thead>";
    for (var i = 0; i < data.length; i++) {
        head_start += "<th>"+data[i]+"</th>";

    }
    var head= head_start + head_end;

    // 生成表單的內容部分

    // 遍歷 series 每一項的 data 部分,每次獲取 data 中 index 相同的資料=月份相同
    var series = content_data;
    var content_start = "<tbody>";
    var content_end="</tbody>";

    // row_names 這裡是月份的資料,其他情況可能是域名列表
    var rows =  []; //儲存table 每一行 tr 中的的資訊
    for (var i = 0; i < row_names.length; i++) {
        rows[i] = "<tr><td>" + row_names[i]+"</td>";
        for (var j = 0; j < series.length; j++) {
            var cur = series[j].data[i];
            rows[i] +='<td>'+cur+'</td>';
        }
        rows[i]+='</tr>';
        content_start+=rows[i];
    }


    var content = content_start + content_end;

    //完整的表單,設定display="none"
    var table_tmp =
    '<table class="excel_tool_tmp" id="hehe">'+
    head+content+
    '</table>';


    // 將元素新增到 dom 樹中
    $(target).append(table_tmp);
    $('.excel_tool_tmp').hide();
};

$(function(){
    var head_data = ['蒸發量','降水量','快樂指數'];
    var row_names = ['1月','2月','3月','4月','5月','6月','7月','8月','9月','10月','11月','12月'];
    var content_data = [{data:[2.0, 4.9, 7.0, 23.2, 25.6, 76.7, 135.6, 162.2, 32.6, 20.0, 6.4, 3.3]},
                        {data:[2.6, 5.9, 9.0, 26.4, 28.7, 70.7, 175.6, 182.2, 48.7, 18.8, 6.0, 2.3]},
                        {data:[6.0, 4.6, 7.0, 23.2, 25.6, 76.7, 135.6, 162.2, 32.6, 26.0, 6.4, 3.3]}];
    var target = 'body';
    excel_tool.buildTable(head_data,row_names,content_data, target);

});
根據表格資訊生成 excel 檔案的實現。
var tableToExcel = (function() {
    var uri = 'data:application/vnd.ms-excel;base64,',
        template = '<html xmlns:o="urn:schemas-microsoft-com:office:office" xmlns:x="urn:schemas-microsoft-com:office:excel" '+
        'xmlns="http://www.w3.org/TR/REC-html40"><head>'+

        '<!--[if gte mso 9]>'+
        '<xml><x:ExcelWorkbook><x:ExcelWorksheets>'+
        '<x:ExcelWorksheet><x:Name>{worksheet}</x:Name>'+
        '<x:WorksheetOptions><x:DisplayGridlines/>'+
        '</x:WorksheetOptions></x:ExcelWorksheet>'+
        '</x:ExcelWorksheets></x:ExcelWorkbook></xml>'+
        '<![endif]-->'+

        '<meta http-equiv="content-type" content="text/plain; charset=UTF-8"/>'+
        '</head>'+
        '<body><table>{table}</table></body></html>',
        base64 = function(s) {
            return window.btoa(unescape(encodeURIComponent(s)))
        },
        format = function(s, c) {
            return s.replace(/{(\w+)}/g, function(m, p) {
                return c[p];
            })
        }
    return function(table, name) {
        if (!table.nodeType) table = document.getElementById(table)
        var ctx = {
            worksheet: name || 'worksheet',//name || 'Worksheet' || 'hehe',
            table: table.innerHTML
        }
        window.location.href = uri + base64(format(template, ctx))
    }
})()
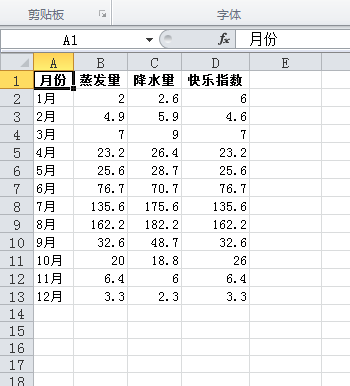
輸出
進一步擴充套件
idea1:
如何將多個表匯入到excel 一個 sheet 中,並能區分?
idea2:
如何將多個表匯入到excel中的不同的 sheet 中?

