
markdown繪圖外掛----mermaid簡介
作者:黃永剛
mermaid簡介
當撰寫文件的時候,對於流程圖的生成大多使用Visio等繁重的工具,沒有一種輕便的工具能夠畫圖從而簡化文件的編寫,就像markdown那樣。
mermaid解決這個痛點,這是一個類似markdown語法的指令碼語言,通過JavaScript實現圖表的生成。
先來看個例子:
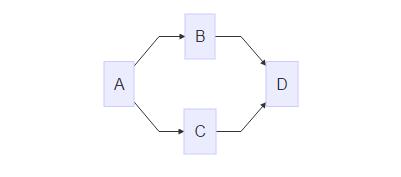
1.流程圖(flowchart)
graph LR;
  A-->B;
  A-->C;
  B-->D;
  C-->D;
生成的圖表如下所示:
2. 時序圖(sequence diagram)
sequenceDiagram 生成的圖表如下所示:
3.甘特圖(gantt diagram)
gantt
dateFormat YYYY-MM-DD
title Adding GANTT diagram functionality to mermaid
section A section
Completed task :done, des1, 2014-01-06,2014-01-08
Active task :active, des2, 2014-01-09, 3d
future task : des3, after des2, 5d
future task2 : des4, after 生成的表如下:
下游專案
Mermaid 是由Knut Sveidqbist發起旨在輕便化的文件撰寫。所有開發者:開發者列表
Graph
graph LR
    A --> B
這是申明一個由左到右,水平向右的圖。\
可能方向有:
- TB - top bottom
- BT - bottom top
- RL - right left
- LR - left right
- TD - same as TB
節點與形狀
預設節點
graph LR
id1

注意:’id’顯示在節點內部。
文字節點

graph LR
id[This is the text in the box];
圓角節點

graph LR
id(This is the text in the box);
圓節點(The form of a circle)
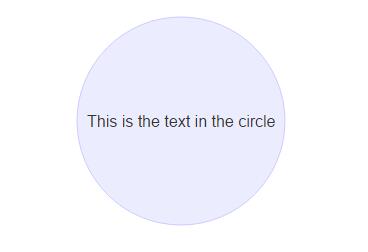
graph LR
id((This is the text in the circle));
非對稱節點(asymetric shape)

graph LR
id>This is the text in the box]
菱形節點(rhombus)
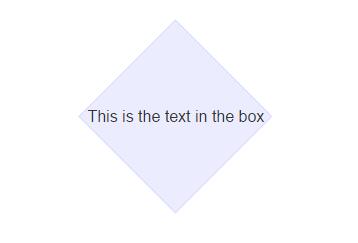
graph LR
id{This is the text in the box}
連線線
節點間的連線線有多種形狀,而且可以在連線線中加入標籤:
箭頭形連線
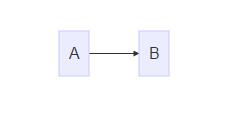
graph LR;
  A-->B;
開放行連線
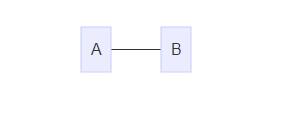
graph LR
A --- B
標籤連線
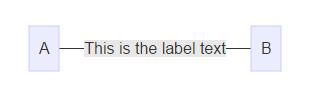
graph LR
A -- This is the label text --- B;
箭頭標籤連線
A–>|text|B\
或者\
A– text –>B
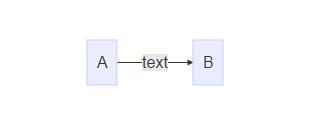
graph LR
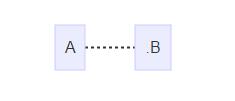
A-- text -->B虛線(dotted link,點連線)
-.->

graph LR
A-.->B
-.-.
graph LR
A-.-.B
標籤虛線
-.text.->
graph LR
A-.text.->B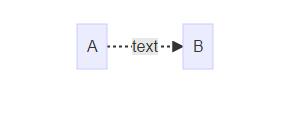
粗實線
==>
graph LR
A==>B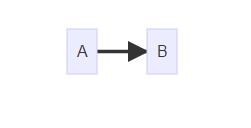
===
graph LR
A===B
標籤粗線
=\=text\==>
graph LR
A==text==>B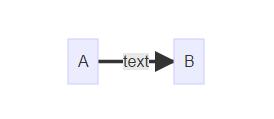
=\=text\===
graph LR
A==text===B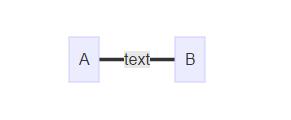
特殊的語法
使用引號可以抑制一些特殊的字元的使用,可以避免一些不必要的麻煩。
graph LR\
d1[“This is the (text) in the box”]
graph LR
d1["This is the (text) in the box"]
html字元的轉義字元
轉義字元的使用語法:
流程圖定義如下:
graph LR\
A[“A double quote:#quot;”] –> B[“A dec char:#9829;”]
渲染後的圖如下:

graph LR
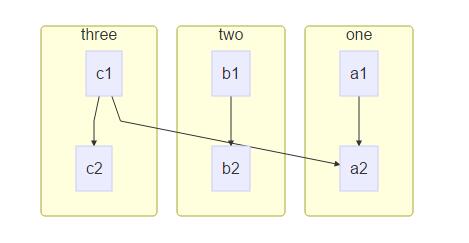
A["A double quote:#quot;"]-->B["A dec char:#9829;"]子圖(Subgraphs)
subgraph title\
graph definition\
end
示例:
graph TB
        subgraph one
        a1 --> a2
        en
        subgraph two
        b2 --> b2
        end
        subgraph three
        c1 --> c2
        end
        c1 --> a2
結果:
基礎fontawesome支援
如果想加入來自frontawesome的圖表字型,需要像frontawesome網站上那樣引用的那樣。\
詳情請點選:fontawdsome
引用的語法為:++fa:#icon class name#++
graph TD
      B["fa:fa-twitter for peace"]
      B-->C[fa:fa-ban forbidden]
      B-->D(fa:fa-spinner);
      B-->E(A fa:fa-camerra-retro perhaps?);
渲染圖如下:
graph TD
      B["fa:fa-twitter for peace"]
      B-->C[fa:fa-ban forbidden]
      B-->D(fa:fa-spinner);
      B-->E(A fa:fa-camera-retro perhaps?);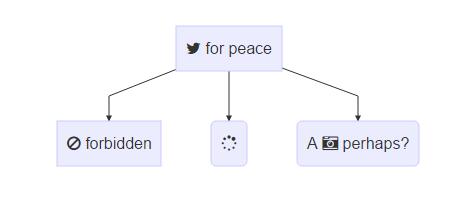
第二部分—圖表(graph)
定義連線線的樣式
graph LR
     id1(Start)-->id2(Stop)
     style id1 fill:#f9f,stroke:#333,stroke-width:4px;
     style id2 fill:#ccf,stroke:#f66,stroke-width:2px,stroke-dasharray:5,5;
渲染結果:

graph LR
     id1(Start)-->id2(Stop)
     style id1 fill:#f9f,stroke:#333,stroke-width:4px;
     style id2 fill:#ccf,stroke:#f66,stroke-width:2px,stroke-dasharray:5,5;
備註:這些樣式參考CSS樣式。
樣式類
為了方便樣式的使用,可以定義類來使用樣式
類的定義示例:
classDef className fill:#f9f,stroke:#333,stroke-width:4px;對節點使用樣式類:
class nodeId className;同時對多個節點使用相同的樣式類:
class nodeId1,nodeId2 className;可以在CSS中提前定義樣式類,應用在圖表的定義中。
graph LR
      A-->B[AAABBB];
      B-->D;
      class A cssClass;
預設樣式類:\
當沒有指定樣式的時候,預設採用。
classDef default fill:#f9f,stroke:#333,stroke-width:4px;示例:
graph LR
    classDef default fill:#f90,stroke:#555,stroke-width:4px;
    id1(Start)-->id2(Stop)
結果:
graph LR
classDef default fill:#f90,stroke:#555,stroke-width:4px;
id1(Start)-->id2(Stop)
序列圖(sequence diagram)1
示例:
sequenceDiagram
  Alice->>John: Hello John, how are you ?
  John-->>Alice: Great!
  Alice--->>John: Huang,you are better .
  John-->>Alice: yeah, Just not bad.
sequenceDiagram
Alice->>John: Hello John, how are you ?
John-->>Alice: Great!
Alice->>John: Hung,you are better .
John-->>Alice: yeah, Just not bad.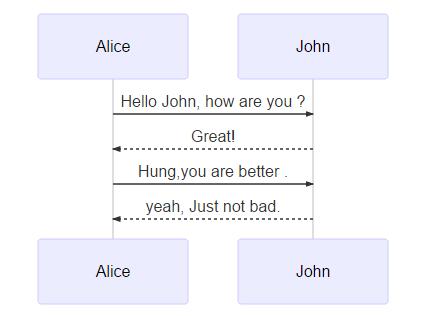
觀察上面的圖,如果想讓John出現在前面,如何控制,mermaid通過設定參與者(participants)的順序控制二者的順序。上面的圖可以做如下修改:
sequenceDiagram\
participant John\
participant Alice\
Alice->>John:Hello John,how are you?\
John–>>Alice:Great!
sequenceDiagram
  participant John
  participant Alice
  Alice-xJohn:Hello John,how are you?
  John-->>Alice:Great!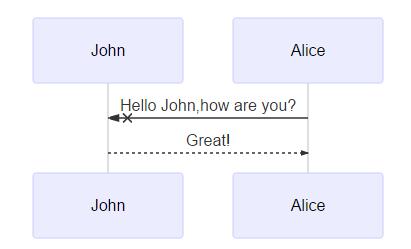
訊息的語法:
實線或者虛線的使用:
[Actor][Arrow][Actor]:Message text\
Arrow的六種樣式:
- ->
- –>
- ->>
- –>>
- -x
- –x
示例:
sequenceDiagram
    Alice->John: Hello John, how are you ?
    John-->Alice:Great!
    Alice->>John: dont borther me !
    John-->>Alice:Great!
    Alice-xJohn: wait!
    John--xAlice: Ok!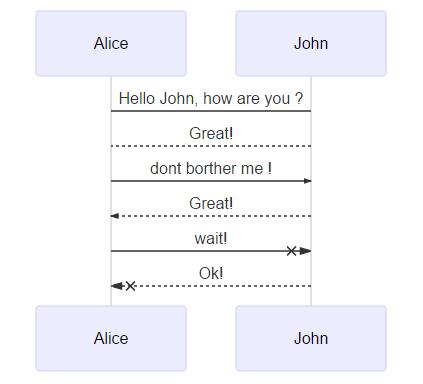
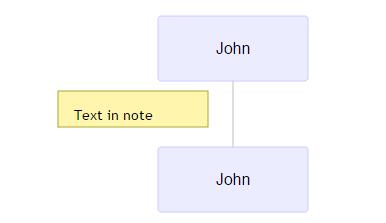
便籤
給序列圖增加便籤:\
具體規則:\
[right of | left of | over][Actor]:Text\
示例:
sequenceDiagram
  participant John
  Note left of John: Text in note
結果:
跨越兩個Actor的便籤:
sequenceDiagram
  Alice->John:Hello John, how are you?
  Note over Alice,John:A typical interaction
sequenceDiagram
Alice->>John:Hello John, how are you?
Note over Alice,John:A typical interaction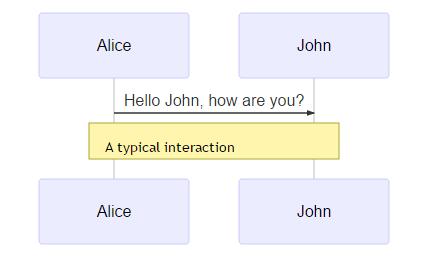
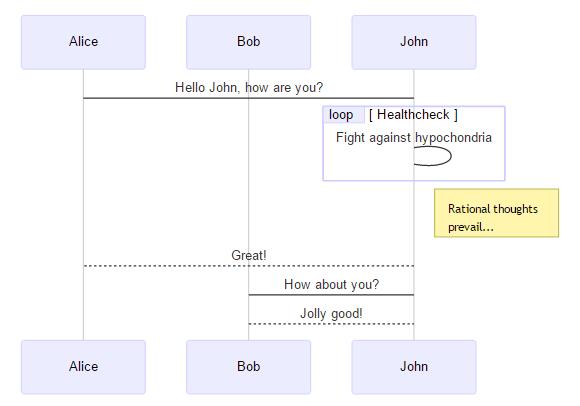
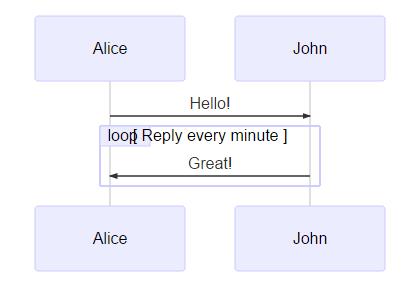
迴圈Loops
在序列圖中,也可以使用迴圈,具體規則如下:
loop Loop text
... statements...
end
示例:
sequenceDiagram
  Alice->>John: Hello!
  loop Reply every minute
    John->>Alice:Great!
  end
渲染結果:
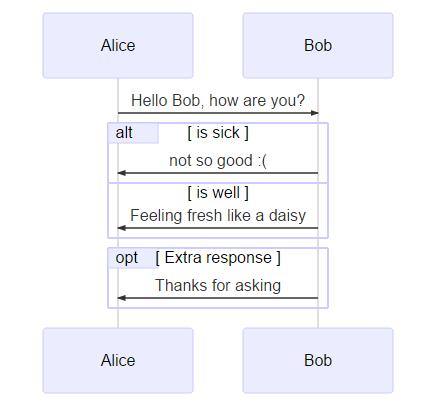
選擇ALT
在序列圖中選擇的表達。規則如下:
alt Describing text
...statements...
else
...statements...
end
或者使用opt(推薦在沒有else的情況下使用)
opt Describing text
...statements...
end
示例:
sequenceDiagram
  Alice->>Bob: Hello Bob, how are you?
  alt is sick
    Bob->>Alice:not so good :(
  else is well
    Bob->>Alice:Feeling fresh like a daisy:)
  end
  opt Extra response
    Bob->>Alice:Thanks for asking
  end
渲染結果如下:
甘特圖(gantt)2
甘特圖是一類條形圖,由Karol Adamiechi在1896年提出, 而在1910年Henry Gantt也獨立的提出了此種圖形表示。通常用在對專案終端元素和總結元素的開始及完成時間進行的描述。
示例:
gantt
dateFormat YYYY-MM-DD

section S1
T1: 2014-01-01, 9d

section S2
T2: 2014-01-11, 9d

section S3
T3: 2014-01-02, 9d
gantt
dateFormat YYYY-MM-DD
section S1
T1: 2014-01-01, 9d
section S2
T2: 2014-01-11, 9d
section S3
T3: 2014-01-02, 9d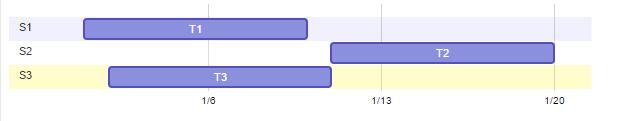
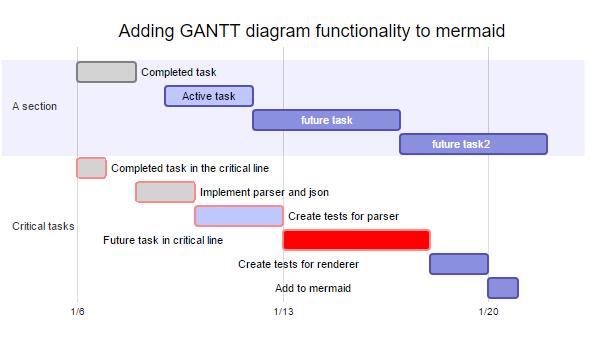
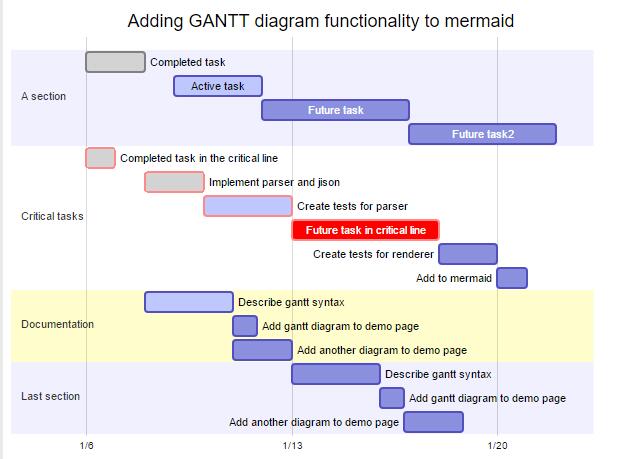
先來看一個大的例子:
    gantt
    dateFormat  YYYY-MM-DD
    title Adding GANTT diagram functionality to mermaid

    section A section
    Completed task            :done,    des1, 2014-01-06,2014-01-08
    Active task               :active,  des2, 2014-01-09, 3d
    Future task               :         des3, after des2, 5d
    Future task2               :         des4, after des3, 5d

    section Critical tasks
    Completed task in the critical line :crit, done, 2014-01-06,24h
    Implement parser and jison          :crit, done, after des1, 2d
    Create tests for parser             :crit, active, 3d
    Future task in critical line        :crit, 5d
    Create tests for renderer           :2d
    Add to mermaid                      :1d

    section Documentation
    Describe gantt syntax               :active, a1, after des1, 3d
    Add gantt diagram to demo page      :after a1  , 20h
    Add another diagram to demo page    :doc1, after a1  , 48h

    section Last section
    Describe gantt syntax               :after doc1, 3d
    Add gantt diagram to demo page      : 20h
    Add another diagram to demo page    : 48h
獲得的圖渲染後如下:
| header 1 | header 2 |
|---|---|
| title | 標題 |
| dateFormat | 日期格式 |
| section | 模組 |
| Completed | 已經完成 |
| Active | 當前正在進行 |
| Future | 後續待處理 |
| crit | 關鍵階段 |
| 日期缺失 | 預設從上一項完成後 |
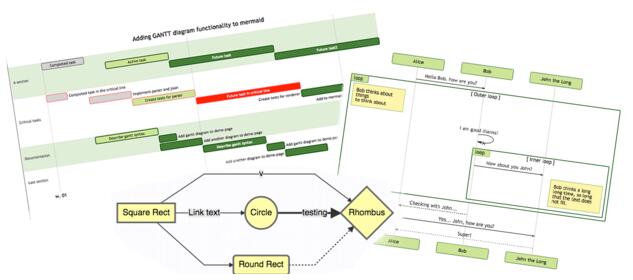
Demo
graph TB
    sq[Square shape] --> ci((Circle shape))

    subgraph A subgraph
        di{Diamond with  line break} -.-> ro(Rounded)
        di==>ro2(Rounded square shape)
    end

    e --> od3>Really long text with linebreak<br>in an Odd shape]

    cyr[Cyrillic]-->cyr2((Circle shape Начало));

    classDef green fill:#9f6,stroke:#333,stroke-width:2px;
    classDef orange fill:#f96,stroke:#333,stroke-width:4px;
    class sq,e green
    class di orange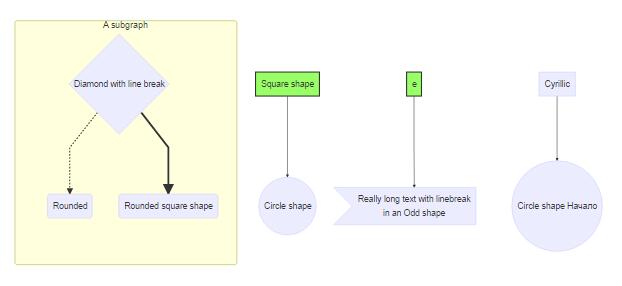
reference
本文原創首發於公眾號:老王和他的IT界朋友們
微信掃描關注微訊號:(原創投稿有驚喜!!!)
 |
|---|