
Linux mtrace命令檢測記憶體洩漏
阿新 • • 發佈:2019-01-11
*這篇來學習一下Linux中的一個命令——mtrace,它是怎麼用的呢?一起來看看。。。→_→*
記憶體洩漏程式碼
#include <stdio.h>

int main()
{
    int *p = NULL;
    p = (int *)malloc(sizeof(int) * 1);

    //free(p);
    return 0;
}
這程式碼太簡單了。。。不解釋。。
mtrace命令的使用
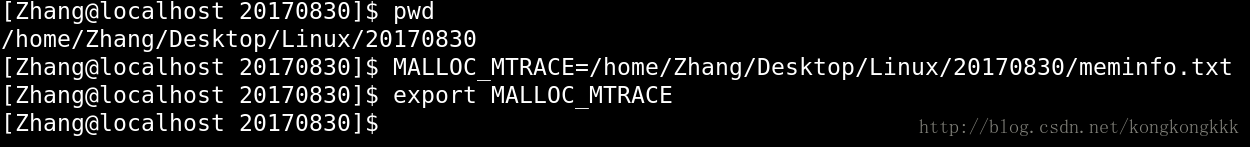
將環境變數MALLOC_TRACE設定為所需輸出檔案的路徑名
在原始碼中引入
mcheck.h標頭檔案
#include <mcheck.h> 在分配記憶體之前呼叫
mtrace();,一般在main函式的開頭呼叫在結束檢測的地方呼叫
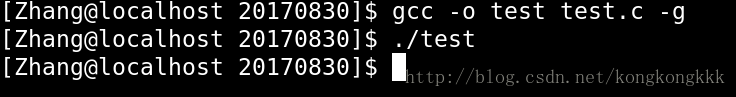
muntrace();,一般在return之前呼叫編譯程式時需要加上
-g選項,
記憶體洩漏資訊將在MALLOC_TRACE環境變數指定的檔案中報告,需要使用mtrace命令將資訊轉換
//mtrace <exec_file_name> <malloc_trace_filename>
mtrace text meminfo.txt
Memory not freed:
-----------------
Address Size Caller 原始碼
1 #include <stdio.h>
2 #include <malloc.h>
3 #include <mcheck.h>
4
5 int main()
6 {
7 mtrace();
8 int *p = NULL;
9
10 p = (int *)malloc(sizeof(int) * 1);
11
12 //free(p);
13
14 muntrace();
15 *是不是很簡單。。。嗯。。。→_→*