Python互動式資料分析報告框架——Dash
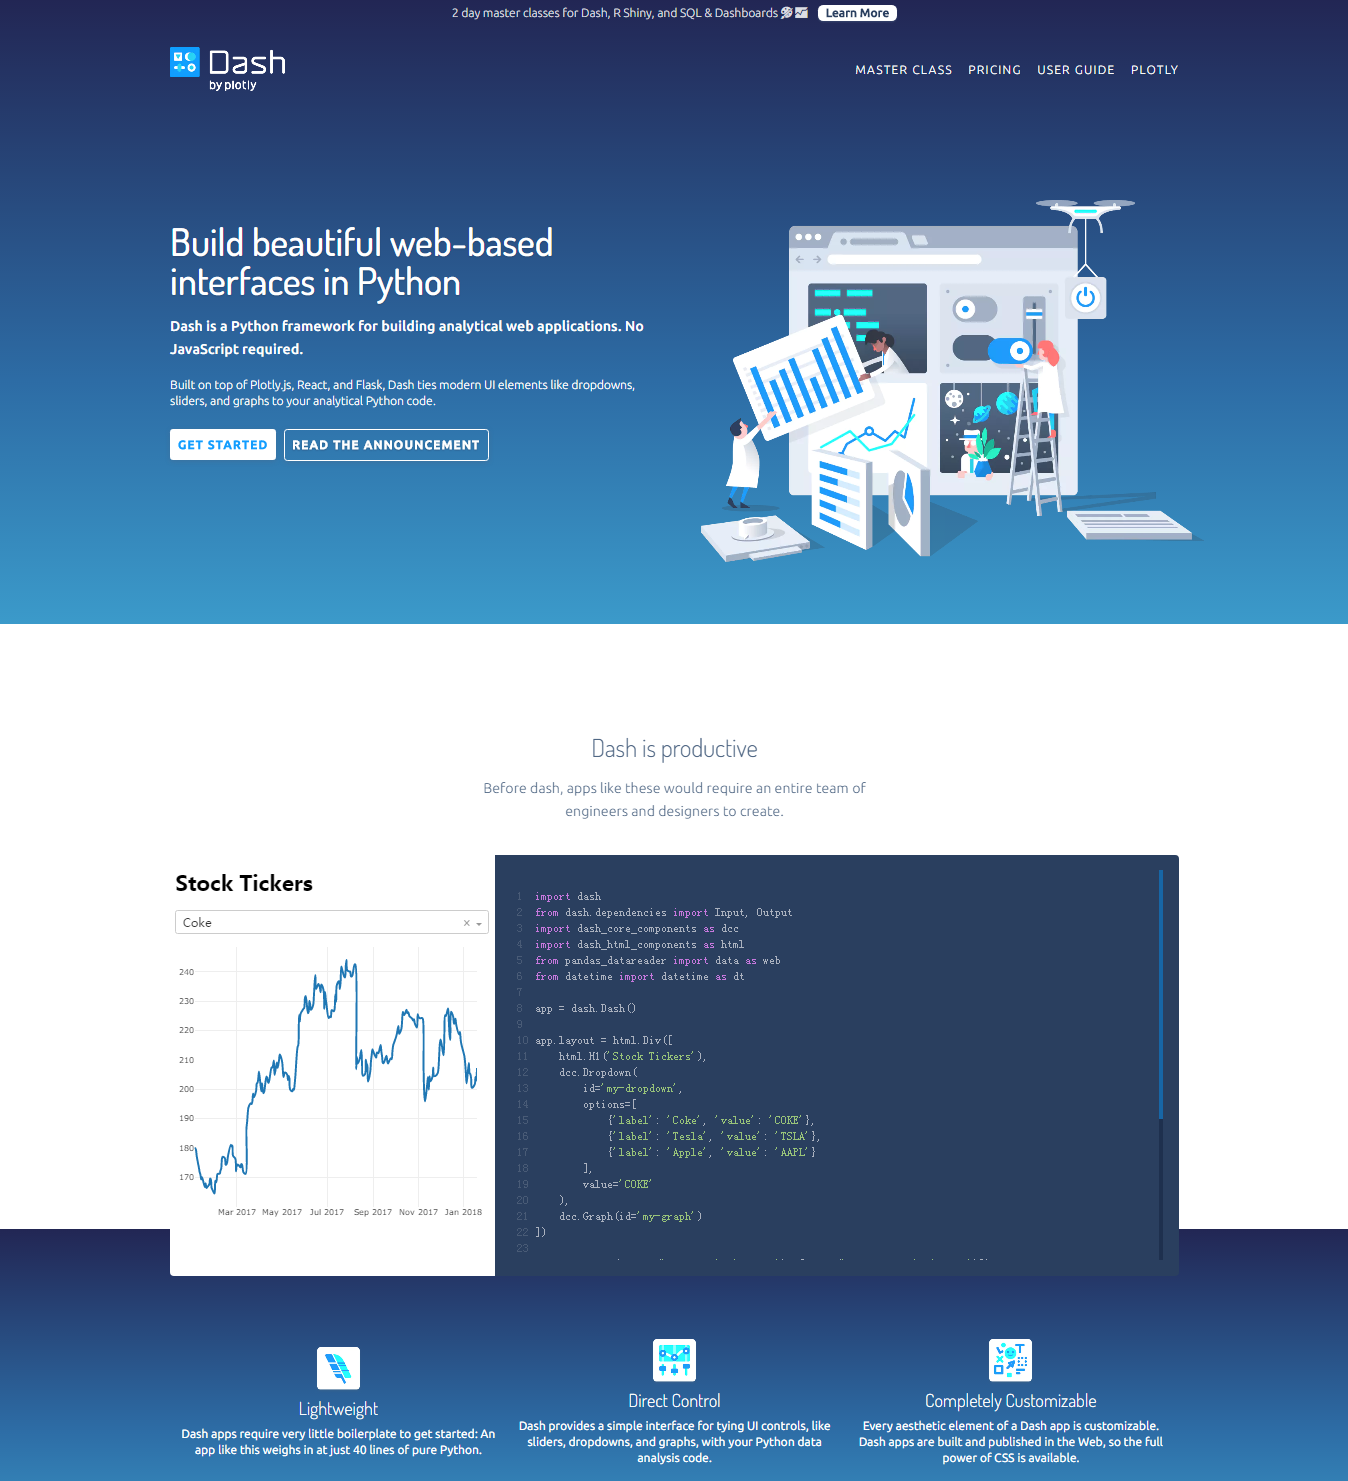
Dash是一個基於Web應用程式、用於分析的Python庫,開發時間已達兩年之久。最初,Plotly在GitHub上公佈了Dash的概念驗證,經過長時間不間斷的開發,Plotly釋出了作為企業級解決方案和開源工具的Dash。Dash專案可用於資料分析、資料探勘、視覺化、建模、儀器控制和報告。這是一個輕量級的專案,只有40行Python,並且提供了一個用於鍵入UI控制元件的介面,包含滑塊,下拉列表和帶程式碼的圖形等等。最重要的是Dash是完全可定製化的。
有企業曾表示,我們與Dash Enterprise的目標是在內部共享Dash應用程式,無需開發人員,儘可能簡單和安全。Dash Enterprise負責URL路由、監控、故障處理、部署、版本控制和程式包管理。使用者可以在本地無限制的使用開源版本,也可以通過Heroku或Digital Ocean等平臺管理Dash應用程式的部署。
Plotly公司在Dash專案網站上寫道:Explore data, tweak your models, monitor your experiments, or roll your own business intelligence platform. Dash is the front-end to your analytical Python backend。(來自

關於具體介紹可參見作者Plotly,Chris Pamer寫的內容,原文連結:
https://link.jianshu.com/?t=https%3A%2F%2Fmedium.com%2F%40plotlygraphs%2Fintroducing-dash-5ecf7191b503
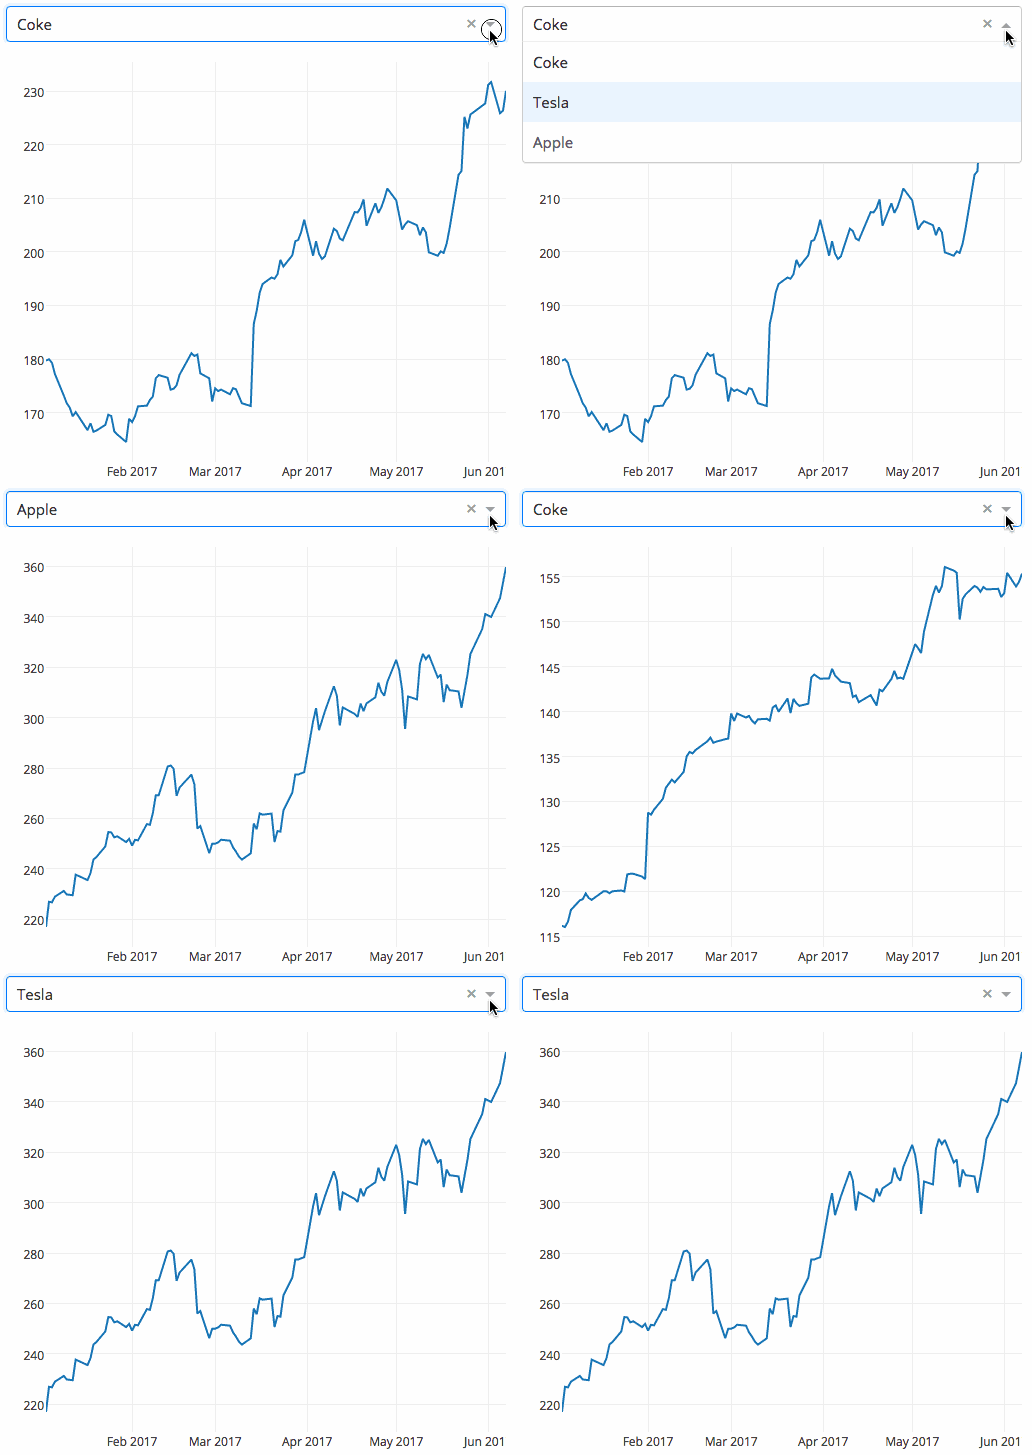
下面是一個將下拉選單與支援D3.js的Plotly圖形結合的Dash應用。使用者通過篩選下拉選單來選擇不同的值,程式程式碼就能動態地從谷歌金融匯入資料到Pandas的DataFrame。然而,這個應用僅用了43行程式碼!

Dash應用:Hello World,更多請查閱使用者指南
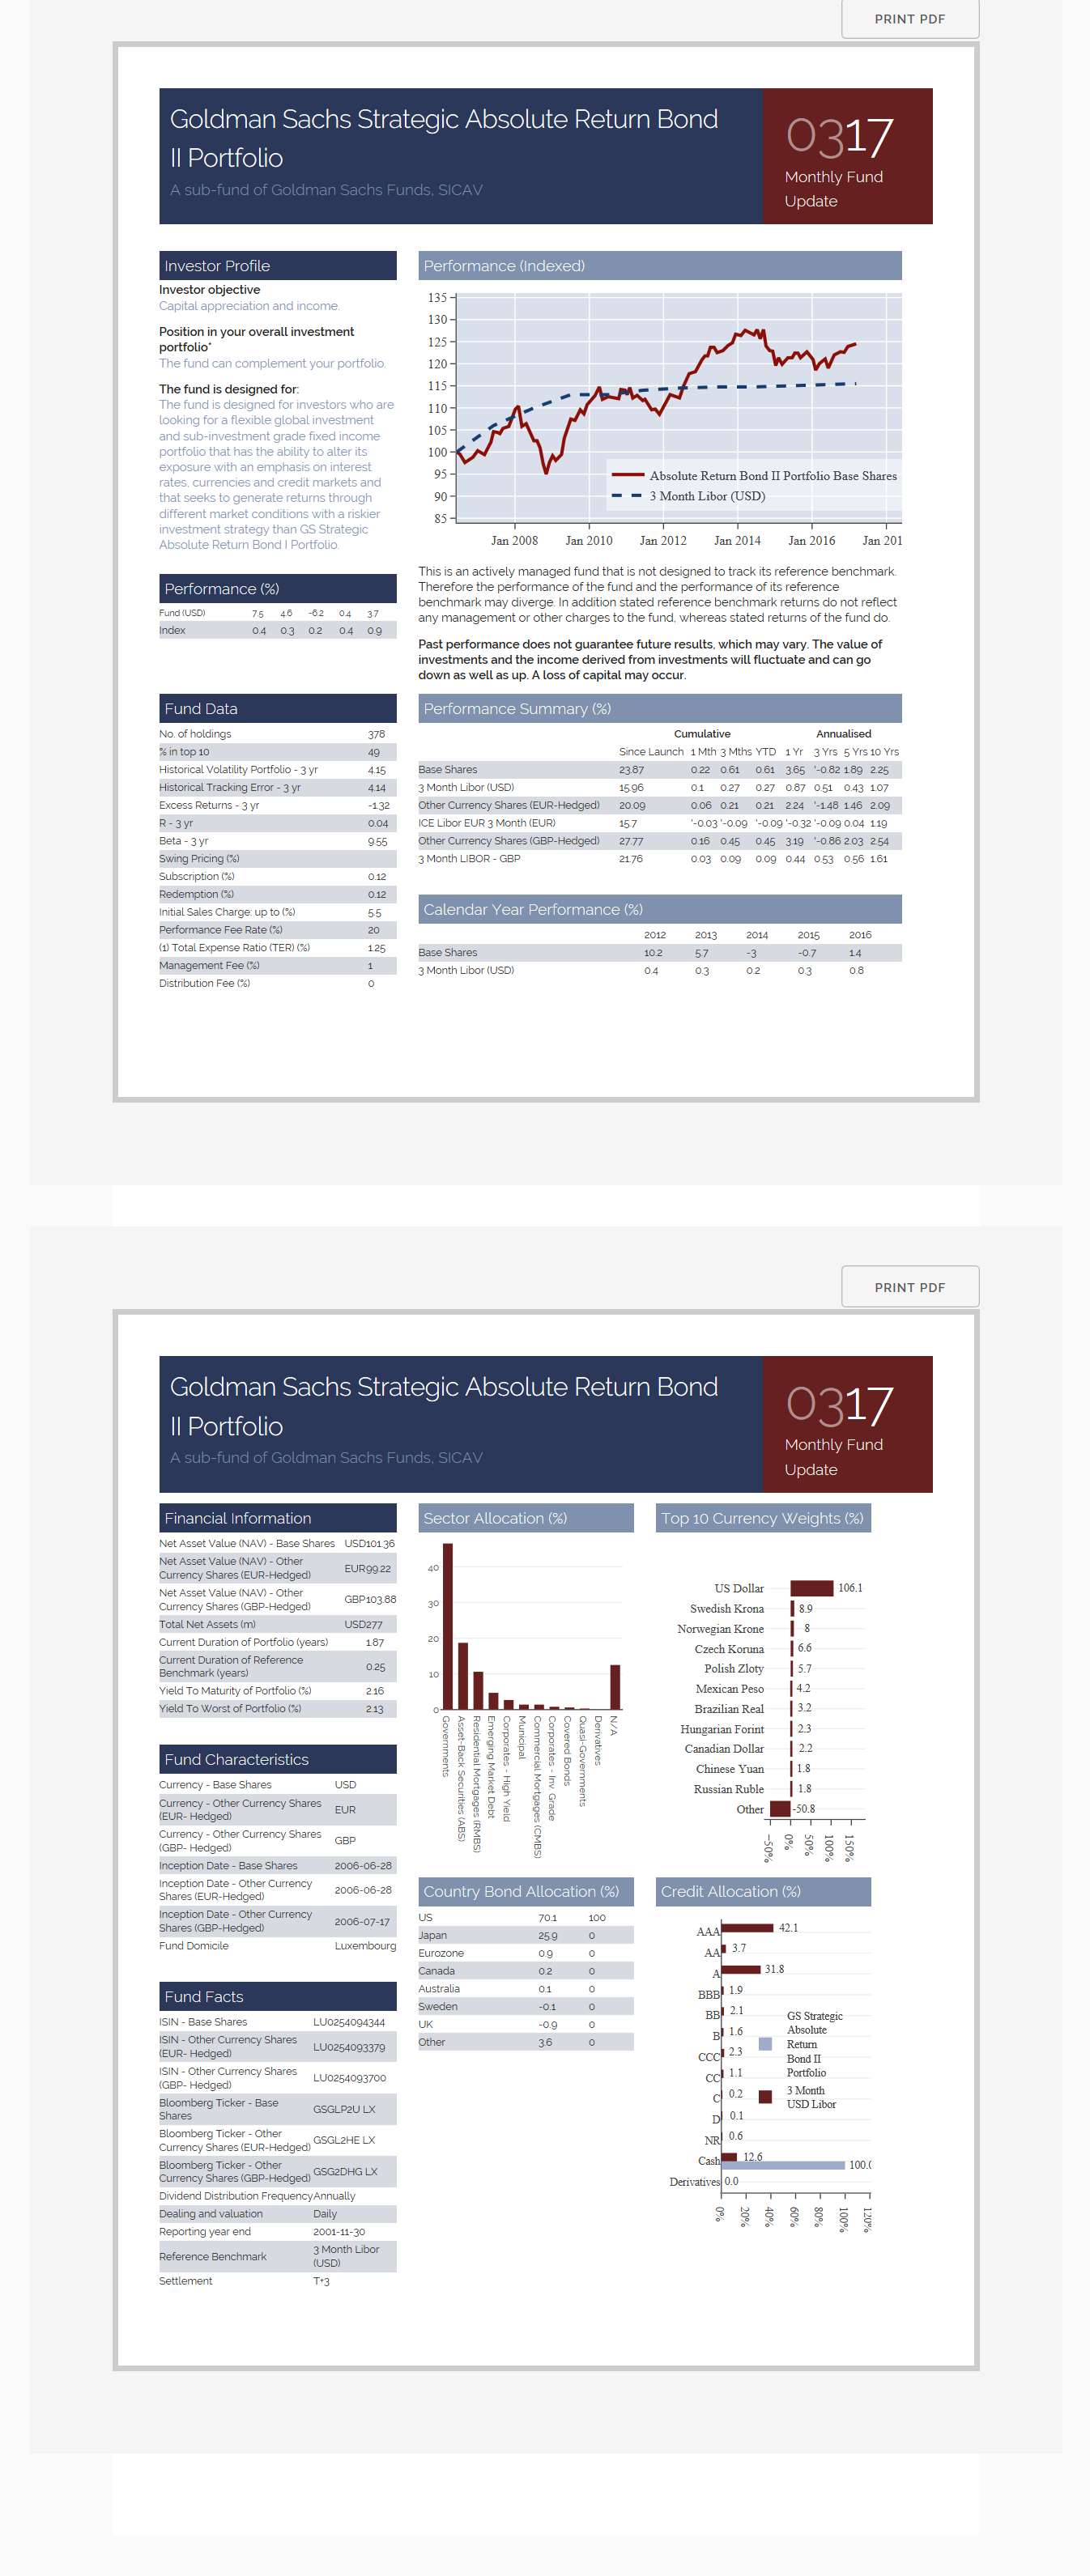
下面是官網上的一個超級精彩的互動式介面的例子:
import dash
from dash.dependencies import Input, Output
import dash_core_components as dcc
import dash_html_components as html
from plotly import graph_objs as go
from datetime import datetime as dt
import json
import pandas as pd
df_fund_data = pd.read_csv('https://plot.ly/~jackp/17534.csv')
df_fund_data.head()
df_perf_summary = pd.read_csv('https://plot.ly/~jackp/17530.csv' # Describe the layout, or the UI, of the app
app.layout = html.Div([
html.Div([ # page 1
html.A([ 'Print PDF' ],
className="button no-print",
style=dict(position="absolute", top=-40, right=0)),
html.Div([ # subpage 1
# Row 1 (Header)
html.Div([
html.Div([
html.H5('Goldman Sachs Strategic Absolute Return Bond II Portfolio'),
html.H6('A sub-fund of Goldman Sachs Funds, SICAV', style=dict(color='#7F90AC')),
], className = "nine columns padded" ),
html.Div([
html.H1([html.Span('03', style=dict(opacity=0.5)), html.Span('17')]),
html.H6('Monthly Fund Update')
], className = "three columns gs-header gs-accent-header padded", style=dict(float='right') ),
], className = "row gs-header gs-text-header"),
html.Br([]),
# Row 2
html.Div([
html.Div([
html.H6('Investor Profile', className = "gs-header gs-text-header padded"),
html.Strong('Investor objective'),
html.P('Capital appreciation and income.', className = 'blue-text'),
html.Strong('Position in your overall investment portfolio*'),
html.P('The fund can complement your portfolio.', className = 'blue-text'),
html.Strong('The fund is designed for:'),
html.P('The fund is designed for investors who are looking for a flexible \
global investment and sub-investment grade fixed income portfolio \
that has the ability to alter its exposure with an emphasis on interest \
rates, currencies and credit markets and that seeks to generate returns \
through different market conditions with a riskier investment strategy \
than GS Strategic Absolute Return Bond I Portfolio.', className = 'blue-text' ),
], className = "four columns" ),
html.Div([
html.H6(["Performance (Indexed)"],
className = "gs-header gs-table-header padded"),
html.Iframe(src="https://plot.ly/~jackp/17553.embed?modebar=false&link=false&autosize=true", \
seamless="seamless", style=dict(border=0), width="100%", height="250")
], className = "eight columns" ),
], className = "row "),
# Row 2.5
html.Div([
html.Div([
html.H6('Performance (%)', className = "gs-header gs-text-header padded"),
html.Table( make_dash_table( df_perf_pc ), className = 'tiny-header' )
], className = "four columns" ),
html.Div([
html.P("This is an actively managed fund that is not designed to track its reference benchmark. \
Therefore the performance of the fund and the performance of its reference benchmark \
may diverge. In addition stated reference benchmark returns do not reflect any management \
or other charges to the fund, whereas stated returns of the fund do."),
html.Strong("Past performance does not guarantee future results, which may vary. \
The value of investments and the income derived from investments will fluctuate and \
can go down as well as up. A loss of capital may occur.")
], className = "eight columns" ),
], className = "row "),
# Row 3
html.Div([
html.Div([
html.H6('Fund Data', className = "gs-header gs-text-header padded"),
html.Table( make_dash_table( df_fund_data ) )
], className = "four columns" ),
html.Div([
html.H6("Performance Summary (%)", className = "gs-header gs-table-header padded"),
html.Table( modifed_perf_table, className = "reversed" ),
html.H6("Calendar Year Performance (%)", className = "gs-header gs-table-header padded"),
html.Table( make_dash_table( df_cal_year ) )
], className = "eight columns" ),
], className = "row "),
], className = "subpage" ),
], className = "page" ),
html.Div([ # page 2
html.A([ 'Print PDF' ],
className="button no-print",
style=dict(position="absolute", top=-40, right=0)),
html.Div([ # subpage 2
# Row 1 (Header)
html.Div([
html.Div([
html.H5('Goldman Sachs Strategic Absolute Return Bond II Portfolio'),
html.H6('A sub-fund of Goldman Sachs Funds, SICAV', style=dict(color='#7F90AC')),
], className = "nine columns padded" ),
html.Div([
html.H1([html.Span('03', style=dict(opacity=0.5)), html.Span('17')]),
html.H6('Monthly Fund Update')
], className = "three columns gs-header gs-accent-header padded", style=dict(float='right') ),
], className = "row gs-header gs-text-header"),
# Row 2
html.Div([
# Data tables on this page:
# ---
# df_fund_info = pd.read_csv('https://plot.ly/~jackp/17544/.csv')
# df_fund_characteristics = pd.read_csv('https://plot.ly/~jackp/17542/.csv')
# df_fund_facts = pd.read_csv('https://plot.ly/~jackp/17540/.csv')
# df_bond_allocation = pd.read_csv('https://plot.ly/~jackp/17538/')
# Column 1
html.Div([
html.H6('Financial Information', className = "gs-header gs-text-header padded"),
html.Table( make_dash_table( df_fund_info ) ),
html.H6('Fund Characteristics', className = "gs-header gs-text-header padded"),
html.Table( make_dash_table( df_fund_characteristics ) ),
html.H6('Fund Facts', className = "gs-header gs-text-header padded"),
html.Table( make_dash_table( df_fund_facts ) ),
], className = "four columns" ),
# Column 2
html.Div([
html.H6('Sector Allocation (%)', className = "gs-header gs-table-header padded"),
html.Iframe(src="https://plot.ly/~jackp/17560.embed?modebar=false&link=false&autosize=true", \
seamless="seamless", style=dict(border=0), width="100%", height="300"),
html.H6('Country Bond Allocation (%)', className = "gs-header gs-table-header padded"),
html.Table( make_dash_table( df_bond_allocation ) ),
], className = "four columns" ),
# Column 3
html.Div([
html.H6('Top 10 Currency Weights (%)', className = "gs-header gs-table-header padded"),
html.Iframe(src="https://plot.ly/~jackp/17555.embed?modebar=false&link=false&autosize=true", \
seamless="seamless", style=dict(border=0), width="100%", height="300"),
html.H6('Credit Allocation (%)', className = "gs-header gs-table-header padded"),
html.Iframe(src="https://plot.ly/~jackp/17557.embed?modebar=false&link=false&autosize=true", \
seamless="seamless", style=dict(border=0), width="100%", height="300"),
], className = "four columns" ),
], className = "row"),
], className = "subpage" ),
], className = "page" ),
])
external_css = [ "https://cdnjs.cloudflare.com/ajax/libs/normalize/7.0.0/normalize.min.css",
"https://cdnjs.cloudflare.com/ajax/libs/skeleton/2.0.4/skeleton.min.css",
"//fonts.googleapis.com/css?family=Raleway:400,300,600",
"https://codepen.io/plotly/pen/KmyPZr.css",
"https://maxcdn.bootstrapcdn.com/font-awesome/4.7.0/css/font-awesome.min.css"]
for css in external_css:
app.css.append_css({ "external_url": css })
external_js = [ "https://code.jquery.com/jquery-3.2.1.min.js",
"https://codepen.io/plotly/pen/KmyPZr.js" ]
for js in external_js:
app.scripts.append_script({ "external_url": js })
app.server.run()
#* Running on http://127.0.0.1:5000/ (Press CTRL+C to quit)執行:
相關推薦
Python互動式資料分析報告框架——Dash
Dash是一個基於Web應用程式、用於分析的Python庫,開發時間已達兩年之久。最初,Plotly在GitHub上公佈了Dash的概念驗證,經過長時間不間斷的開發,Plotly釋出了作為企業級解決方案和開源工具的Dash。Dash專案可用於資料分析、資料探勘、
Titanic資料分析報告(python)
# Titanic資料分析報告 ## 1.1 資料載入與描述性統計 載入所需資料與所需的python庫。 import statsmodels.api as sm import statsmodels.formula.api as
2018年8月以太坊DApp資料分析報告
近日,鏈塔資料BlockData釋出了《2018年8月以太坊DApp資料分析報告》,報告顯示,以太坊上的DApp數量多達775個,形成了一個較為完善的開發生態圈,累計交易筆數多達3.0036603億,累計交易金額超過59億ETH。 1 以太坊DApp總數達775個 以太坊是
利用python進行資料分析(第二版) pdf下載
適讀人群 :適合剛學Python的資料分析師或剛學資料科學以及科學計算的Python程式設計者。 閱讀本書可以獲得一份關於在Python下操作、處理、清洗、規整資料集的完整說明。本書第二版針對Python 3.6進行了更新,並增加實際案例向你展示如何高效地解決一系列資料分析問題。你將在閱讀
《利用Python進行資料分析》學習記錄
第8章249頁 原語句:party_counts = pd.crosstab(tips.day, tips.size) 現在的pandas似乎有個size屬性,就是計算資料的大小,而不會返回那一列具體的資料,比如這裡tips這個csv資料,其裡面包含一列size資料,現在來執行這句語句的話,
資料基礎---《利用Python進行資料分析·第2版》第12章 pandas高階應用
之前自己對於numpy和pandas是要用的時候東學一點西一點,直到看到《利用Python進行資料分析·第2版》,覺得只看這一篇就夠了。非常感謝原博主的翻譯和分享。 前面的章節關注於不同型別的資料規整流程和NumPy、pandas與其它庫的特點。隨著時間的發展,pandas發展出了更多適
資料基礎---《利用Python進行資料分析·第2版》第6章 資料載入、儲存與檔案格式
之前自己對於numpy和pandas是要用的時候東學一點西一點,直到看到《利用Python進行資料分析·第2版》,覺得只看這一篇就夠了。非常感謝原博主的翻譯和分享。 訪問資料是使用本書所介紹的這些工具的第一步。我會著重介紹pandas的資料輸入與輸出,雖然別的庫中也有不少以此為目的的工具
資料基礎---《利用Python進行資料分析·第2版》第4章 NumPy基礎:陣列和向量計算
之前自己對於numpy和pandas是要用的時候東學一點西一點,直到看到《利用Python進行資料分析·第2版》,覺得只看這一篇就夠了。非常感謝原博主的翻譯和分享。 NumPy(Numerical Python的簡稱)是Python數值計算最重要的基礎包。大多數提供科學計算的包都是用Nu
資料基礎---《利用Python進行資料分析·第2版》第11章 時間序列
之前自己對於numpy和pandas是要用的時候東學一點西一點,直到看到《利用Python進行資料分析·第2版》,覺得只看這一篇就夠了。非常感謝原博主的翻譯和分享。 時間序列(time series)資料是一種重要的結構化資料形式,應用於多個領域,包括金融學、經濟學、生態學、神經科學、物
資料基礎---《利用Python進行資料分析·第2版》第10章 資料聚合與分組運算
之前自己對於numpy和pandas是要用的時候東學一點西一點,直到看到《利用Python進行資料分析·第2版》,覺得只看這一篇就夠了。非常感謝原博主的翻譯和分享。 對資料集進行分組並對各組應用一個函式(無論是聚合還是轉換),通常是資料分析工作中的重要環節。在將資料集載入、融合、準備好之
資料基礎---《利用Python進行資料分析·第2版》第8章 資料規整:聚合、合併和重塑
之前自己對於numpy和pandas是要用的時候東學一點西一點,直到看到《利用Python進行資料分析·第2版》,覺得只看這一篇就夠了。非常感謝原博主的翻譯和分享。 在許多應用中,資料可能分散在許多檔案或資料庫中,儲存的形式也不利於分析。本章關注可以聚合、合併、重塑資料的方法。 首先
資料基礎---《利用Python進行資料分析·第2版》第7章 資料清洗和準備
之前自己對於numpy和pandas是要用的時候東學一點西一點,直到看到《利用Python進行資料分析·第2版》,覺得只看這一篇就夠了。非常感謝原博主的翻譯和分享。 在資料分析和建模的過程中,相當多的時間要用在資料準備上:載入、清理、轉換以及重塑。這些工作會佔到分析師時間的80%或更多。
資料基礎---《利用Python進行資料分析·第2版》第5章 pandas入門
之前自己對於numpy和pandas是要用的時候東學一點西一點,直到看到《利用Python進行資料分析·第2版》,覺得只看這一篇就夠了。非常感謝原博主的翻譯和分享。 pandas是本書後續內容的首選庫。它含有使資料清洗和分析工作變得更快更簡單的資料結構和操作工具。pandas經常和其它工
誰說菜鳥不會資料分析(入門篇)----- 學習筆記6(資料分析報告)
1、資料分析報告:三大作用四項基本原則 定義 是根據資料分析原理和方法,運用資料來反映、研究和分析某項事物的現狀、問題、原因、本質和規律,並得出結論,提出解決辦法的一種分析應用文體。 這種文體是決策者認識事物、瞭解事物、
分享 《利用Python進行資料分析(第二版)》高清中文版PDF+英文版PDF+原始碼
資料下載:https://pan.baidu.com/s/1K3DjJ9S1S3AxpacEElNF9Q 《利用Python進行資料分析(第二版)》【中文版和英文版】【高清完整版PDF】+【配套原始碼】 《利用Python進行資料分析(第二版)》中文和英文兩版對比學習, 高清完整版PDF,帶書籤,可複製貼
1.2 Why Python for Data Analysis(為什麼使用Python做資料分析)
1.2 Why Python for Data Analysis?(為什麼使用Python做資料分析) 這節我就不進行過多介紹了,Python近幾年的發展勢頭是有目共睹的,尤其是在科學計算,資料處理,AI方面,否則大家也不會來看這本書了。 使用Python的一些優點 Python是一門膠
python轉型資料分析、機器學習、人工智慧學習路線
最近1年的主要學習時間,都投資到了 python 資料分析和資料探勘上面來了,雖然經驗並不是十分豐富,但希望也能把自己的經驗分享下,幫助到更多想轉行python資料分析和人工智慧的朋友,給廣大同學朋友規劃個適合學習規劃。 我大學學習的應用化學,後來畢業做了2年全棧設計師(PS:設計和前端
使用Python進行資料分析--------------NumPy基礎:陣列和向量計算
NumPy(Numerical重點內容 Python的簡稱) 是Python數值計算最重要的基礎包。大多數提供科學計算的包都是用NumPy的陣列作為構建基礎。 NumPy的部分功能如下: - ndarray,一個具有向量算術運算和複雜廣播能力的快速且節省空間的多維陣列。 -
[SQL Server玩轉Python] 二.T-SQL查詢表格值及Python實現資料分析
在開發專案過程中,更多的是通過Python訪問SQL Server資料庫介面,進行資料探勘的操作;而SQL Server2016版本之後,嵌入了強大的R、Python、Machine Learning等功能,尤其是Python程式碼置於儲存過程中,可以實現一些便捷資料分析功能。 本系
利用Python進行資料分析之第七章 記錄2 資料規整化:清理、轉換、合併、重塑
索引上的合併 DataFrame中傳入引數left_index=True或者right_index=True(或者兩個都傳入),表示DataFrame的index(索引)被用作兩個DataFrame連線的連線鍵,如下: dataframe1 = DataFrame({'key':

