資料視覺化神器matplotlib學習之路(二)
阿新 • • 發佈:2019-01-12
之前學習了matplotlib的一些基本畫圖方法(檢視上一節),這次主要是學習在圖中加一些文字和其其它有趣的東西。
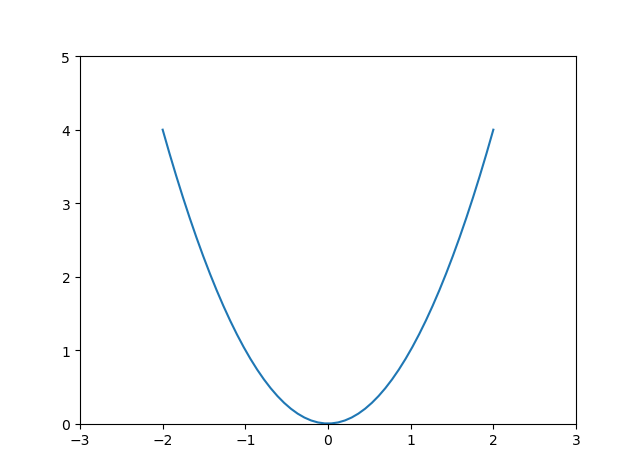
先來個最簡單的圖
from matplotlib import pyplot as plt
import numpy as np

x = np.linspace(-2, 2, 50)
y = x**2
plt.xlim((-3,3))#設定x座標範圍
plt.ylim((0,5))#設定y座標範圍
plt.plot(x,y)

plt.show()

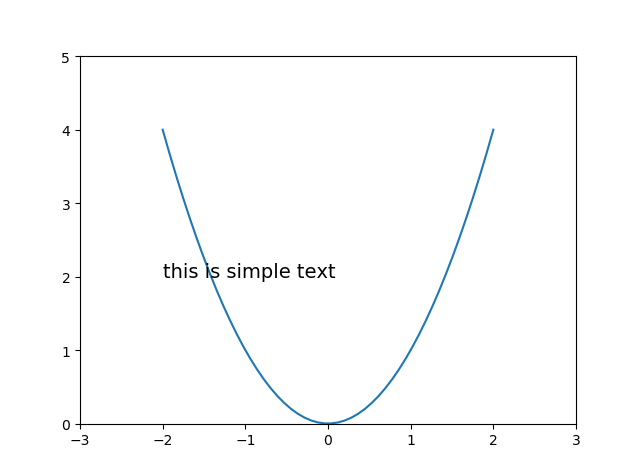
接下來加一下文字描述,第一種方法,plt.text()
from matplotlib import pyplot as pltimport numpy as np x = np.linspace(-2, 2, 50) y = x**2 plt.xlim((-3,3))#設定x座標範圍 plt.ylim((0,5))#設定y座標範圍 plt.plot(x,y) plt.text( -2,#文字x座標 2,#文字y座標 'this is simple text',#內容 fontsize=14#文字大小 ) plt.show()

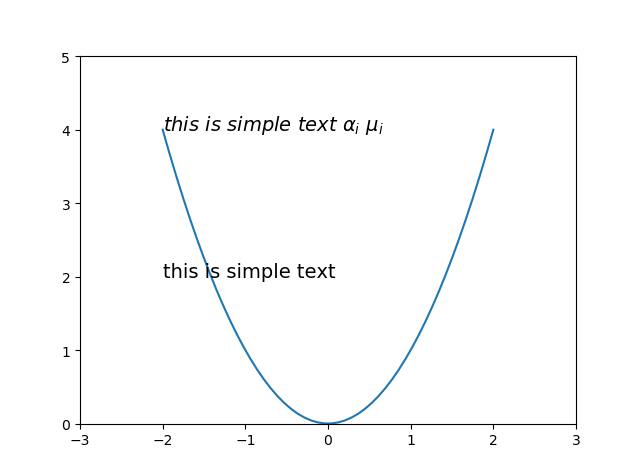
這裡我們還可以用$$將文字包住可以讓文字字型更加好看,同時也可以實現一些特殊字元的表達,比如一些常用的數學符號,這對寫論文有好處
from matplotlib importpyplot as plt import numpy as np x = np.linspace(-2, 2, 50) y = x**2 plt.xlim((-3,3))#設定x座標範圍 plt.ylim((0,5))#設定y座標範圍 plt.plot(x,y) plt.text( -2,#文字x座標 2,#文字y座標 'this is simple text',#內容 fontsize=14#文字大小 ) plt.text( -2,#文字x座標 4,#文字y座標 r'$this\ is\ simple\ text\ \alpha_i\ \mu_i$',#用$包住空格需要用轉義字元轉義,包括特殊字元alpha等也需要,alpha_i表示alpha下標i fontsize=14#文字大小 ) plt.show()

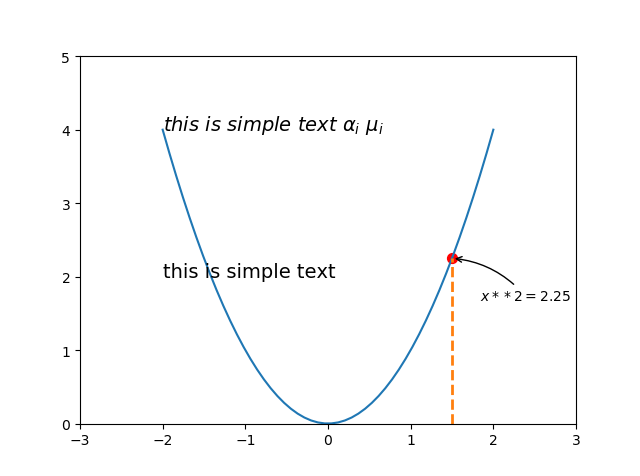
接下來,第二種文字描述,這種要高階一點,用plt.annotate()實現,比如我要在曲線上x=1.5的地方加
並且向右下偏移一些位置,加上一個曲線箭頭指向x=1.5的點
from matplotlib import pyplot as plt
import numpy as np

x = np.linspace(-2, 2, 50)
y = x**2
plt.xlim((-3,3))#設定x座標範圍
plt.ylim((0,5))#設定y座標範圍
plt.plot(x,y)

plt.text(
    -2,#文字x座標
    2,#文字y座標
    'this is simple text',#內容
    fontsize=14#文字大小
)
plt.text(
    -2,#文字x座標
    4,#文字y座標
    r'$this\ is\ simple\ text\ \alpha_i\ \mu_i$',#內容
    fontsize=14#文字大小
)

x0 = 1.5
y0 = x0**2
plt.scatter(x0, y0, s=50, color='r')
plt.plot([x0, x0], [0, y0], linestyle='--', linewidth=2.0)
plt.annotate(r'$x**2=%s$' % y0,#內容
             xy=(x0, y0),#文字座標
             xycoords='data',#文字座標以data也就是x,y的值為基準
             xytext=(+20,-30),#文字相對於xy座標的偏移量
             textcoords='offset points',#偏移基準
             arrowprops=dict(arrowstyle='->',connectionstyle='arc3,rad=.2')#畫一個曲線箭頭指向xy座標
             )

plt.show()

效果如上圖,此方法比較複雜,詳細引數說明可以參考官方api,好了,到這裡就大功告成!
接下來準備學習一些常用型別的圖了。
