New – Custom Metrics for Amazon CloudWatch
 You can now store your business and application metrics in Amazon CloudWatch. You can view graphs, set alarms, and initiate automated actions based on these metrics, just as you can for the metrics that CloudWatch already stores for your AWS resources.
This new custom metrics feature can be used in two different ways:
- You can add to the metrics collected for Amazon EC2 Instances, EBS Volumes, Elastic Load Balancers, and Relational Database Service DB Instances. The metrics that you store can be technical (system performance indicators) or business-related (user activity over the monitoring period).
- You can store metrics for any generic resource. You can use CloudWatch to create a single, integrated storage and aggregation point for all of the metrics that you want to watch and to monitor.
You don’t have to pre-define the new metrics and you don’t have to pre-allocate storage space. Instead, you simply store new values and the new metric will be created automatically. You can monitor resources that run on EC2, or anywhere else on the Internet.
You can access all of your metrics using the ListMetrics function. Any graphing or visualization tools that have the ability to pull existing data from CloudWatch should be able to access user-defined metrics with little or no change.
Metric values can be stored using the new PutMetricData function or the mon-put-data command-line tool.
CloudWatch metrics are scoped within namespaces, and can be further qualified by up to 10 dimensions. For example, latency could be tracked for a pair of applications (“App1” and “App2”) while keeping the values isolated from each other:
$ mon-put-data -namespace App1 -metric-name Latency -value 104
 $ mon-put-data -namespace App2 -metric-name Latency -value 120
Dimensions are name-value pairs that can be used to expand on a metric’s identity. For example, latency could be tracked on a per-host basis by adding a dimension to the example above:
$ mon-put-data -namespace App1 -metric-name Latency -dimensions "Host=host1" -value 104
 $ mon-put-data -namespace App1 -metric-name Latency -dimensions "Host=host2" -value 180
 $ mon-put-data -namespace App1 -metric-name Latency -dimensions "Host=host3" -value 90
Metrics that have different namespaces and dimensions are treated as discrete metrics. In this example, the application-level metrics are isolated from the host-level metrics. In other words, be sure to Put the metrics in the same format that you want to Get them.
CloudWatch lets you provide metric data from multiple sources. You can monitor scalable applications comprised of hundreds or even thousands of EC2 instances. New hosts can contribute to existing application-level metrics as they join the fleet. You can then retrieve the data for individual hosts or for the entire fleet.
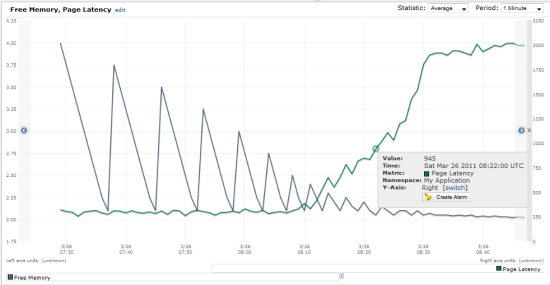
Here’s an example of the kinds of insights that can be gained when you use custom metrics. The following chart shows the amount of free memory (the jagged line) and the application’s page latency:

As you can see, page latency increases as free memory decreases (looks like there’s some garbage collection going on as well).
You can choose from among a list of standard units (Seconds, Bits, Bytes, Percent, Count, Bytes/Second, Bits/Second, and Count/Second) when you store metrics. Metrics with different units will not be included in CloudWatch’s statistical calculations. All metrics are retained for a period of two weeks.
Once your metrics are stored in CloudWatch, you can treat them as if they were metrics on AWS resources. You can use the GetMetricStatistics function to calculate the Average, Min, Max, Sum, and Count for any time range and you can also graph the metrics in the AWS Management Console.
You can also create CloudWatch Alarms on your metrics. For example, if you monitor latency, you can set up an SNS notification to email you when average latency remains elevated for 15 minutes.
You can use any of the metrics to AutoScale your fleet of Amazon EC2 instances.This means that you could scale up and down on metrics that are only indirectly related to system load or performance, but that may be better indicators of application performance or customer experience: number of registered users, number of active sessions, page load times, or error rates.
The Custom Metrics are priced on a per-metric basis. You’ll pay $0.50 per metric per month regardless of the number of values that you store for the metric. We are also reducing the price of EC2 Detailed Monitoring to $3.50 per month (7 metrics * $0.50 / metric). You can store 10 metrics per month at no charge; these can be used for both Custom Metrics and EC2 Detailed Monitoring metrics.
The AWS SDKs for .Net, Java, and PHP now support this new feature.
The HP SiteScope product now includes support for CloudWatch’s new user-defined metrics. You can configure SiteScope to report any desired metrics to CloudWatch, and then use them to drive scaling decisions, raise alarms, or simply chart them. Integration is as easy as editing the new function in the SiteScope configuration file and creating a new SiteScope tag to define the data to be routed to CloudWatch. You can also embed HP diagnostics probes in your AMIs so that newly launched EC2 instances appear in the HP Diagnostics UI. Read more about both features in the HP APM (Application Performance Management) blog.
Some of our customers started to use this new feature during the private beta. Here’s what they had to say:
 Loggly.com provides log management and analysis for customers such as about.me, an AOL Inc. company that ties together multiple social networking site profiles into a unified personal homepage. Kord Campbell (Founder and CEO) told us:
Loggly makes it easy for businesses to handle the large amounts of log data they generate every day, and now customers like AOLs about.me are asking us to deliver actionable alerts on subsets of the log data About.me needs to know right away when response times from the social networking sites slow down or errors arise. By integrating with Amazon CloudWatch alarms, we can now automatically deliver this information to about.me and retain our focus on the core logging service.
 Bizo is a business-to-business marketing platform operated as an online service. According to Larry Ogrodnek (Bizo’s Director of Engineering):
Bizo is hyper-focused on the performance of our systems and data that our B2B marketing customers count on every day. The new functionality in Amazon CloudWatch enables us to monitor the availability of our back-end services without managing our own monitoring system. We can now gain insight into the health and performance of our systems to a level of detail that simply wasnt cost-effective before.
 BitRock provides simplified deployment of open-source applications through its BitNami.org website. Daniel Lopez Ridruejo (BitRock’s Founder) told us that:
BitNami Cloud Hosting helps businesses deploy and manage applications on AWS, by automatically integrating those applications with Amazon CloudWatch, were able to easily help our customers monitor their Amazon EC2 instances and Amazon EBS volumes and scale up and down based on application-level metrics such as the number of simultaneous connections or the internal load of the database.
By the way, the CloudWatch and EC2 teams are hiring:
— Jeff;
相關推薦
New – Custom Metrics for Amazon CloudWatch
You can now store your business and application metrics in Amazon CloudWatch. You can view graphs, set alarms, and initiate automated actions bas
New – VPC Endpoint for Amazon S3
I would like to tell you about a new AWS feature that will allow you to make even better use of Amazon Virtual Private Cloud and Amazon Simple Sto
New – Encryption of Data in Transit for Amazon EFS
Amazon Elastic File System was designed to be the file system of choice for cloud-native applications that require shared access to file-based sto
New P2 Instance Type for Amazon EC2 – Up to 16 GPUs
I like to watch long-term technology and business trends and watch as they shape the products and services that I get to use and to write about. A
New – Encryption of Data at Rest for Amazon Elastic File System (EFS)
We launched Amazon Elastic File System in production form a little over a year ago (see Amazon Elastic File System – Production Ready in Three Reg
Generate and Automate Custom Metrics From Filtered RDS Enhanced Monitoring CloudWatch Logs
Note: Be sure to update 0.00 to the value that you want to measure. 5. Select the Log Data to test, and then choose Test Pattern.
New – GPU-Powered Streaming Instances for Amazon AppStream 2.0
We launched Amazon AppStream 2.0 at re:Invent 2016. This application streaming service allows you to deliver Windows applications to a desktop bro
Create Custom Metrics in CloudWatch
========Sample script====== #!/bin/bash USEDMEMORY=$(free -m | awk 'NR==2{printf "%.2f\t", $3*100/$2 }') TCP_CONN=$(netstat -an | wc -l) TCP_CON
New – Server-Side Encryption for Amazon Simple Queue Service (SQS)
As one of the most venerable members of the AWS family of services, Amazon Simple Queue Service (SQS) is an essential part of many applications. P
New: Server-Side Encryption for Amazon Kinesis Streams
In this age of smart homes, big data, IoT devices, mobile phones, social networks, chatbots, and game consoles, streaming data scenarios are every
New – Cross-Region Replication for Amazon S3
We launched Amazon S3 nine years ago as of last week! Since that time we have added dozens of features, expanded across the globe, and red
New – Your User Pools for Amazon Cognito
Amazon Cognito makes it easy for mobile and web apps to easily add authentication, user management, and data synchronization without having to wri
[Angular] Create a custom validator for template driven forms in Angular
height series complex handle style rop guide temp help User input validation is a core part of creating proper HTML forms. Form validator
27-如何度量分類算法的性能好壞(Scoring metrics for classification)
清晰 如果 hold 同時 under 實踐 能力 nfs 一個數 最近兩天擁抱了北京這個城市,感覺大氣粗獷,整個人都更有精神了。紫禁城好大,頤和園更大,不自量力的我買了聯票,結果根本沒法逛完。北京人民也熱情,坐在船上,開船大爺不停招呼:這邊可以拍十七孔橋了,視野好面積
K8s 多自定義計量(custom metrics)
這裡介紹下如何在K8s設定多個自定義計量。K8s 預設的可用於PHA(Pod Horizon Autoscaling)只有CPU,自定義的計量feature一直處於alpha 測試階段,而且不
論文研讀 “Liar, Liar Pants on Fire”:A New Benchmark Dataset for Fake News Detection
給十月畫個句號 最近上的很喜歡的一門課中,老師要求我們研讀一篇頂會論文並進行分享,好久沒能靜靜地坐下來寫一篇部落格了,接下來希望自己能夠多讀論文的同時把論文的思路以部落格的形式輸出~ 論文來源 “Liar, Liar Pants on Fire”:A New Benchmar
