Eureka客戶端-Hystrix監控頁面(Dashboard)
阿新 • • 發佈:2019-01-14
1.pom.xml
    <properties>
        <java.version>1.8</java.version>
        <spring-cloud.version>Finchley.SR1</spring-cloud.version>
    </properties>
    <dependencyManagement>
        <dependencies>
            <dependency>
                <groupId>org.springframework.cloud</groupId>
                <artifactId>spring-cloud-dependencies</artifactId>
                <version>${spring-cloud.version}</version>
                <type>pom</type>
                <scope>import</scope>
            </dependency>
        </dependencies>
    </dependencyManagement>

    <dependencies>
        <dependency>
            <groupId>org.springframework.boot</groupId>
            <artifactId>spring-boot-starter</artifactId>
        </dependency>

        <dependency>
            <groupId>org.springframework.boot</groupId>
            <artifactId>spring-boot-starter-test</artifactId>
            <scope>test</scope>
        </dependency>
        <dependency>
            <groupId>org.springframework.cloud</groupId>
            <artifactId>spring-cloud-starter-netflix-hystrix</artifactId>
        </dependency>
        <dependency>
            <groupId>org.springframework.cloud</groupId>
            <artifactId>spring-cloud-starter-netflix-hystrix-dashboard</artifactId>
        </dependency>
    </dependencies>
2、application.yml
spring:
  application:
    name: service-hystrix-dashboard
server:
  port: 8605
3、啟動類
@EnableHystrixDashboard
@SpringBootApplication
public class EurekaClientHystrixDashboardApplication {

    public static void main(String[] args) {
        SpringApplication.run(EurekaClientHystrixDashboardApplication.class, args);
    }

}
4、訪問頁面
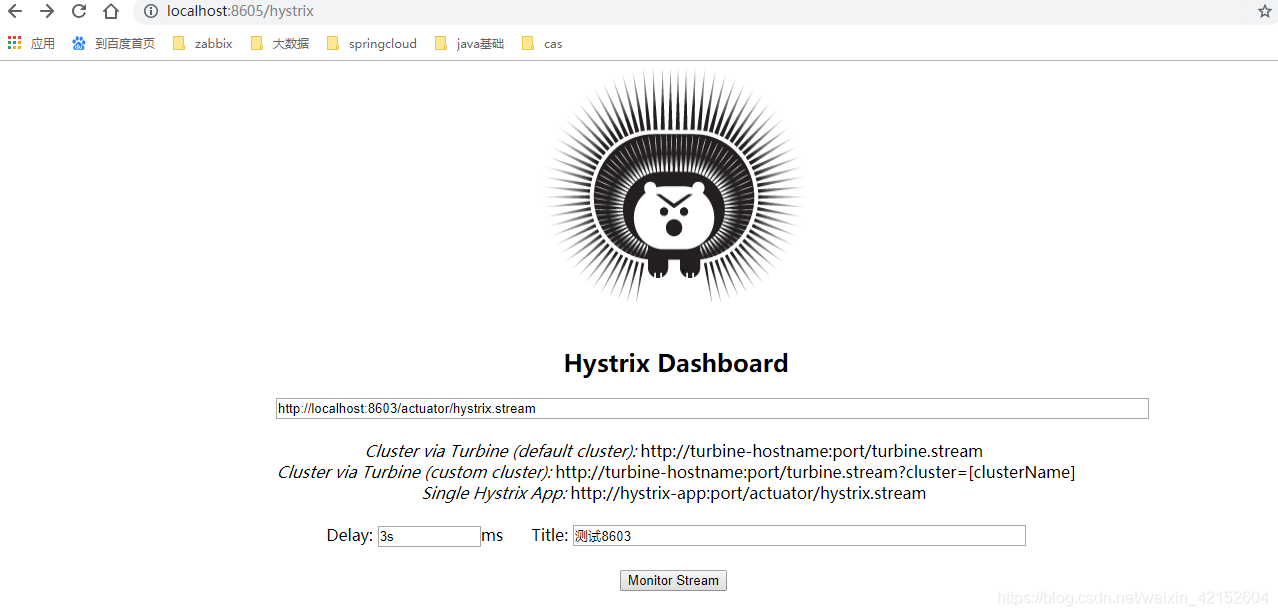
4、進入頁面
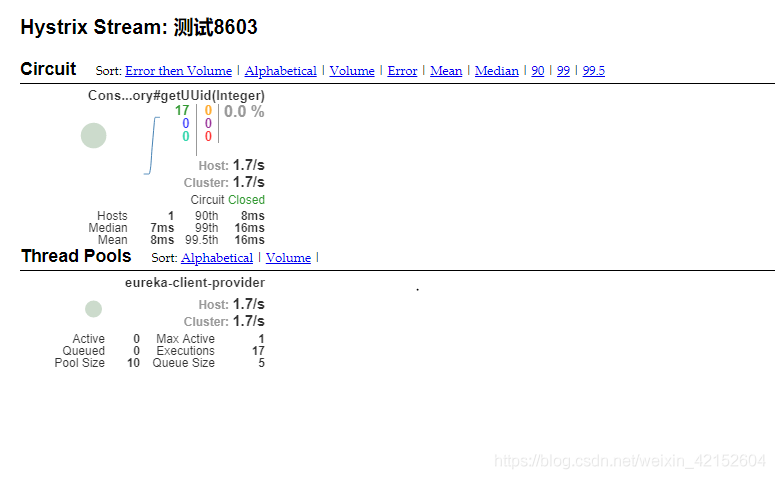
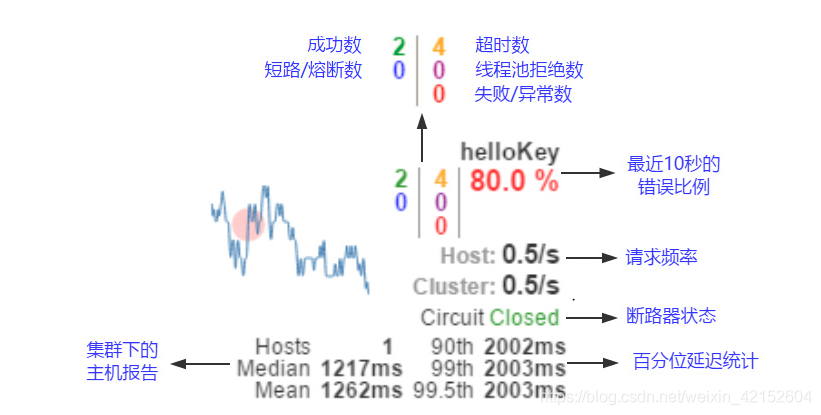
以上圖來說明其中各元素的具體含義:
- 實心圓:它有顏色和大小之分,分別代表例項的監控程度和流量大小。如上圖所示,它的健康度從綠色、黃色、橙色、紅色遞減。通過該實心圓的展示,我們就可以在大量的例項中快速的發現故障例項和高壓力例項。
- 曲線:用來記錄 2 分鐘內流量的相對變化,我們可以通過它來觀察到流量的上升和下降趨勢。
- 其他一些數量指標如下圖所示