Xperf Basics: Recording a Trace(轉)
This post is obsolete – deprecated. For information on newer/easier/better ways of recording xperf traces see Xperf Basics: Recording a Trace (the easy way).
The Windows Performance Toolkit, also known as xperf, is a powerful (and free!) set of tools from Microsoft that allow profiling of all aspects of a Windows computer by using ETW (Event Tracing for Windows). Whether your performance issues are caused by excess CPU usage, waiting on file I/O, or interactions with drivers and other software, xperf usually provides the information needed to diagnose what is going on.
In addition to using xperf to diagnose dozens of tricky performance problems in the software that I work on I have used it to find (and both workaround and report) performance problems in:
- VirtualAlloc
- PowerPoint
- Visual Studio (breakpoint related hangs, SQL access hangs, network access hangs, etc.)
- Windows Live Photo Gallery
But, there is a problem. Xperf is difficult to learn, and the documentation is, well,imperfect. I hope to share some of what I have learned so that this valuable tool can be used by more developers, to make their software more awesome.
This post gives some resources on that most basic of problems, “how do I record a useful xperf trace that contains the information I’m likely to need.”
Recording a trace
Xperf is a command line tool with a bewildering array of options. Some of the things that you might need to specify when recording a trace are:
- What kernel providers (context switches, virtual allocs, sampling profiler, disk I/O) do you want to record?
- What events do you want call stacks for?
- How many memory buffers do you want, and what size do you want them to be?
For best results you should also record product-specific events from a user-mode provider. This requires that you learn:
- How to write a provider manifest
- How to ensure portability to non-Windows platforms (compile-time checks) and pre-Vista platforms (run-time checks)
And so on. It’s a lot to learn and while the basics of recording a kernel trace with a couple of kernel providers are covered pretty well it can be difficult to even find out what other options might be useful.
I have no intention of writing full documentation for xperf. Instead I am going to provide and explain the user-mode providers and the batch files that I use to record traces. That at least should get those interested in xperf off to a better start.
Step 1 – get xperf
Xperf is distributed as part of the Windows Software Development Kit. There are many valuable tools in there, but that’s the topic of another post. For now, run the installer for the latest Platform SDK (currently version 8.0, found here as of May 2012). You will find Windows Performance Toolkit which is the official name for xperf. Install it. You can do what you want with the rest of the Platform SDK. The appropriate version for your operating system (32-bit or 64-bit) will be installed – I found it hidden in “C:\Program Files\Windows Kits\8.0\Windows Performance Toolkit”. The redistributable packages for all Windows flavors, to make installing on other machines easier, should be found at “C:\Program Files (x86)\Windows Kits\8.0\Windows Performance Toolkit\Redistributables”. Make sure the install directory is in your path, then move on.
Step 2 – get the sample providers and batch files
When you unzip the file you’ll find a Visual Studio 2010 solution file. Build the debug or release configuration. You might want to poke around and look at the ReadMe.txt file, the provider manifest file (etwprovider.man) and the batch files.
Step 3 – record a trace
Now things start getting messy. I’m going to try to document all of the necessary steps and gotchas but it’s hard to make it really fool proof.
If you are running 64-bit Windows then there is a registry key that you need to set. And then you need to reboot. The registry key tells Windows to keep information needed for stack walking in non-pageable memory. If you run the command below from an elevated command prompt (yes, it is all one line that is excessively wordwrapped) and then reboot then your call stacks will thank you.
REG ADD "HKLM\System\CurrentControlSet\Control\Session Manager\Memory Management" -v DisablePagingExecutive -d 0x1 -t REG_DWORD -f
In order to use user-mode providers you have to register them. The etwregister.bat file is for that purpose. Like most things xperf you need to open up an administrator command prompt. Navigate to the directory containing etwregister.bat and run it. It should be able to find the MultiProvider.exe that you built (which contains the providers) and etwprovider.man (which defines them) and register them with wevtutil.exe.
Now run etwrecord.bat. Normally I give it the name of a trace file to record to like “etwrecord.bat c:\temp\testtrace.etl”. If you don’t give it a name then it will manufacture one. Either way be careful not to have spaces in your path. At this point tracing has been started. Detailed information about the operation of your computer is being recorded. If you get error messages at this point then read them carefully. Make sure the etwregister.bat step worked properly. Make sure you are running from an administrator command prompt. Make sure you are running Windows 7 (ideal) or Windows Vista in a pinch. ETW tracing is very limited in XP and I have done zero testing on that platform.
Now run the MultiProvider.exe that you built way back in step 2. It will emit some ETW events that your trace is set up to record.
Once MultiProvider.exe has exited you should return to the command prompt and press the ‘any key’ to continue. At this point your trace will be saved to disk. Make sure your trace file name doesn’t contain any spaces because it’s very difficult to get batch files to handle that correctly – and mine don’t. Again, if anything goes wrong then you’ll have to examine the error messages and suggestions very carefully.
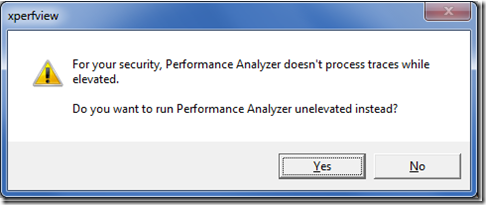
In order to be helpful the batch file will launch xperfview to view the trace. Since the batch file is running as administrator, and since xperfview doesn’t process traces while elevatedyou will get this dialog. Read the link above for details, or just click Yes to view the trace or No to cancel.
Step 4 – looking at the user events
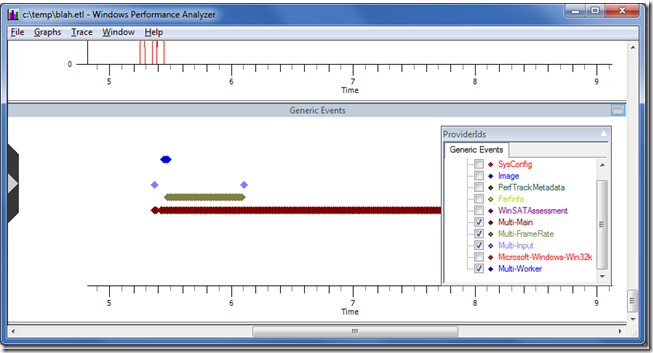
To find the user-provider events – which are great for offering context when looking at the kernel trace data – go to the Generic Events graph in xperfview. It should be at the bottom. You can hover over the diamonds to get a summary of each event. Some of the events are random Windows events with minimal value so I usually use the ProviderIDs configuration dropdown to turn off all except for mine, which are creatively named Multi-Main, etc.
The blue diamonds are designed for worker thread events, the two purple diamonds (your colours may vary) in the screen shot above are faked up input events. The green diamonds are faked up events that indicate the beginning of a frame, as in a video game. The brown diamonds are generic events. The whole purpose of having multiple providers is so that they will show up on different rows in this view. By carefully selecting when to use each provider you can make patterns (such as high and low frame rates, or high and low packet frequencies) visually obvious.
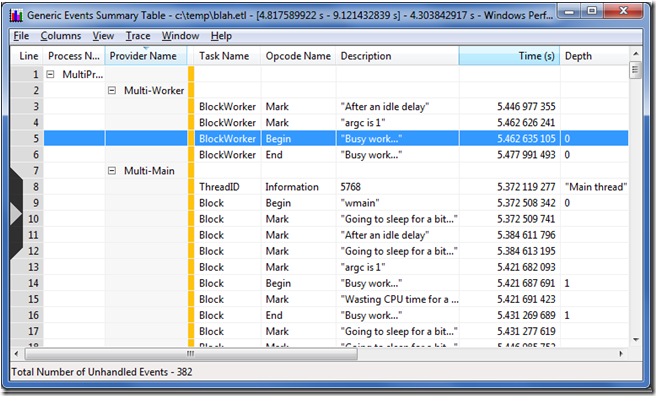
To get more details you need to select a range of time on the graph, right click, and request a summary table. Summary tables are a complex topic, but for now suffice it to say that by enabling and disabling columns to show the ones that you care about, by reordering columns (paying close attention to the gold bar – columns to the left of it are used for hierarchical grouping), and by careful sorting you can answer many questions. Effective use of pivot tables is an art form and is crucial to getting full value from xperf.
On the summary table below we can see, for instance, that the obviously important task “Busy work…” started 5.462635 seconds into the trace, and ended 5.477991493 into the trace. That information then helps us make sense of the other graphs on the main window because they all share a common timeline. Or at least it would if we were profiling something real. Use your imagination and pretend that those Begin/End markers are helping you identify when your AI code is running, or when map loading occurred, or whatever significant event that is taking too long that you want to investigate.
Step 5 – customize it for your purposes
In order to integrate this into your projects and start squashing performance bugs you need to change some things.
- Copy etwprof.* and ETWProvider.man to one of your projects – the DLL or EXE that will contain the providers. You’ll need to copy over the custom build steps for ETWProvider.man and include ETWProviderGenerated.rc (created by those custom build steps) into your existing resource file.
- Modify ETWProvider.man and ETWRegister.bat to change the name of the DLL or EXE that will contain the providers
- Change all of the GUIDs and provider names in ETWProvider.man
- Make the same provider name changes in ETWCommonSettings.bat (so that tracing enables the correct providers) and etwprof.cpp (to adjust the run-time registering of the providers and the emitting of events)
- Run the updated ETWRegister.bat to register your providers – make sure this succeeds.
At that point you should be able to build your code, register your providers, add some calls to your event emitting functions, and record traces that contain your user events.
Step 6 – bonus!
As an extra bonus, when etwrecord.bat finishes it actually leaves tracing running. Tracing continues to a circular buffer and at any time you can save that buffer (retroactive profiling!) to disk with “etwcirc.bat c:\temp\retrotrace.etl”. If you don’t like wasting memory on those circular buffers, “etwcirc.bat stop” will fix things for you.
Step 7 – detailed analysis
Analyzing traces is a huge topic, full of undocumented summary tables, and it will have to be saved for another post.
Step 8 – understanding how it works
This isn’t really a step, but a section to explain some of the details of how this works, to aid in customizing the batch files and providers. There are also lots of comments in the batch files and source code which should be used as a resource.
If you type “etwrecord test.etl” then xperf.exe will be invoked a few times. Once immediately:
xperf -on Latency+POWER+DISPATCHER+FILE_IO+FILE_IO_INIT -stackwalk PROFILE+CSWITCH+READYTHREAD -buffersize 1024 -minbuffers 300 -start gamesession -on Microsoft-Windows-Win32k+Multi-MAIN+Multi-FrameRate+Multi-Input+Multi-Worker
The first command starts tracing. “-on” indicates that the kernel provider should be started, and the plus-sign separated words that follow are individual kernel providers (POWER+DISPATCHER+FILE_IO+FILE_IO_INIT) and kernel provider groups (Latency). See “xperf -providers k” for a list of kernel providers and “xperf -help start” for information on the very complex “-on” syntax.
Then, “-stackwalk” indicates which events should have call stacks recorded for them. Call stacks are very useful, but are also expensive. Note that if you turn on stack walks for an event that is not enabled then nothing happens. See Pigs Can Fly for details of this or look at “xperf -help stackwalk” to see the full list of flags.
Then the size and minimum number of buffers is specified. Setting this too high will waste memory, and too low risks losing events. Note that the buffer size is in KB, so the settings above request 300 MB of buffers for the kernel events. See “xperf -help start” for details.
Then we get to “-start gamesession” which requests that we start a user-mode logging session called gamesession. Any name will do, but only one session of that name can be running at a time. Following that is “-on” and a list of user-mode providers. The first one is a built-in Windows 7 provider. See “xperf -providers” for a list of user-mode providers. The others are the providers that are defined in MultiProvider.exe and registered with ETWregister.bat. Customizing these, in ETWCommonSettings.bat can be important.
Xperf is invoked again after you hit a key to stop tracing:
xperf -stop gamesession -stop -d test.etl
The “-stop gamesession” tells xperf to end our user-mode logging session. The “-stop” by itself then tells xperf to halt the kernel session. The “-d test.etl” tells xperf to take those just-stopped sessions and merge them into a single trace file, for integrated analysis.
There are also a couple of “xperf –loggers” commands. Those are there for diagnostic purposes. When things go awry this undocumented command gives a list of all active ETW sessions that can help understand what is going on.
相關推薦
Xperf Basics: Recording a Trace(轉)
This post is obsolete – deprecated. For information on newer/easier/better ways of recording xperf traces see Xperf Basics: Recording a Trace (the easy
Xperf Basics: Recording a Trace (the easy way)(轉)
Some time ago I wrote a long and detailed post about how to record traces using xperf. The steps needed to record a trace were daunting. However more
ios導航控制器UINavigationController,控制器a跳轉(push)到b後,b跳轉(push)到c,但c後退(pop)進入a
data- object tracking not another target eas com targe 參考:StackOverflow ios導航控制器UINavigationController,控制器a跳轉(push)到b後,b跳轉(push)到c。但c後退
關於startActivityForResult()方法,如果是A跳轉B,B的launchMode屬性為singleInstance,A的onActivityResult()回撥方法會在什麼時候呼叫呢
如題: 關於startActivityForResult()方法,如果是A跳轉B,B的launchMode屬性為singleInstance,A的onActivityResult()回撥方法會在什麼時候呼叫呢? A.B被啟動的時候即呼叫 B.B返回的時候呼叫 C.下一次A啟動的時候呼叫 D.不會
A Bug, a Trace, a Test, a Twist
Here is the story of a bug that I caused, found, and fixed recently. It is not particularly hard or tricky, and it didn’t take long to find and fix. N
Android開發中使用startActivityForResult()方法從Activity A跳轉Activity B出現B退出時A也同時退出的解決辦法
最近一個 App 中用到了 startActivityForResult() 方法,使用的時候卻出現了一些問題,比如我在 Activity A 中呼叫該方法向 Activity B 中跳轉,如果 B 中完成一系列操作之後用 setResult(resultcode, intent); f
iOS 如果頁面 A 跳轉到 頁面 B,A 的 viewDidDisappear 方法和 B 的 viewDidAppear 方法哪個先呼叫?
如果頁面 A 跳轉到 頁面 B,A 的 viewDidDisappear 方法和 B 的 viewDidAppear 方法哪個先呼叫? 1. - (void)pushViewController:(UIViewController *)viewController an
python + selenium 從主視窗A跳轉至主視窗B後,無法定位視窗B的元素的問題
開啟一個新網頁後,資料停留在視窗A,無法更新視窗B的資料,導致視窗B元素無法爬取。 解決方法: 在視窗A與B中間插入程式碼: time.sleep(1)#需要睡一秒 driver.switch_to_window(driver.window_h
在一個Activity中結束另一個Activity的方法;如何是從A跳轉到B, 結束A的;關於Activity在後臺被銷燬的處理;關於Activity在後臺被銷燬的處理
型別一:在一個Activity中結束另一個Activity的方法 下面的以ActivityB 結束ActivityA 為例: 方法一: 1.首先在 ActivityA 中定義一個 Activity
非全屏Activity A跳轉到全屏Activity B後,返回A時介面跟隨狀態列下移
在Activity A的佈局外加一層CoordinatorLayout,並設定android:fitsSystemWindows="true",如下所示 <?xml version="1.0"
JavaScript基礎 a標記 使用onclick事件阻止默認跳轉 onclick事件 與 跳轉 ,onclick事件優先執行。
傳智 技術部 推薦 turn utf 傳智播客 ctype div type 鎮場詩: 清心感悟智慧語,不著世間名與利。學水處下納百川,舍盡貢高我慢意。 學有小成返哺根,願鑄一良心博客。誠心於此寫經驗,願見文者得啟發。—————————————————————
使用mui框架後a標簽無法跳轉
無法 刪除節點 將不 不能 tel tno 刪除 inner bsp 由於最近工作項目上使用到前臺mui框架,筆者在將H5轉換為jsp時,遇見各種各樣問題,原因歸結為對mui框架不熟悉,今天就遇見一個特別奇怪的問題,界面中超鏈接<a>標簽無法跳轉,筆者試著添加點
Enable a SQL Server Trace Flag Globally on Linux
mic perf one border pre 技術分享 directly ati res https://www.mssqltips.com/sql-server-tip-category/226/sql-server-on-linux// Microsoft has
A題之拼音轉數字
scan util length 響應 color sans pop -c 一行 輸入是一個僅僅包括拼音的字符串,請輸出相應的數字序列。轉換關系例如以下: 描寫敘述: 拼音 yi er san si wu liu qi ba jiu 阿拉伯數字 1
【轉】We have a problem with promises
mem eas 也會 同步方法 side pos lld node-js should 這是我看的自認為最好的一篇講解如何使用Promise的文章,原文地址:http://fex.baidu.com/blog/2015/07/we-have-a-problem-with-p
[轉] A*尋路算法C++簡單實現
track pos endpoint 障礙 close math.h 不存在 rec 節點 參考文章: http://www.policyalmanac.org/games/aStarTutorial.htm 這是英文原文《A*入門》,最經典的講解,有demo演示 ht
前端制作之微信小技巧__避免a標簽跳轉到手機自帶瀏覽器
廣泛 沒有 最大 進行 發送 cli bsp 兼容 效果 隨著微信的越來越大眾化,微信的使用程度也越來越高。隨之,產生了一種新的推廣模式,即微信推廣。在這個微信的大平臺上會衍生出許許多多的推廣手段。而移動前端作為服務於手機用戶的手機網頁技術,也不可避免的加入進來。 一些
轉://Oracle A用戶給B用戶授權查詢指定表或視圖權限方案
tab dex reat del 作用 系統 所有 mit 應用 用DNINMSV31賬戶登錄數據庫進行如下操作: CREATE USER NORTHBOUND IDENTIFIED BY NORTHBOUND DEFAULT TABLESPACE "TBS_DNINMS
a不跳轉的擴展
catch rep ret href 種類 oid 調用 try 平臺 結合我們今天學的a標簽防止跳轉我們今天的擴展a 我們常用的在a標簽中有點擊事件:1. a href="JavaScript:js_method();"這是我們平臺上常用的方法,但是這種方法在傳遞thi
JS中點擊a標簽不跳轉
js在開發中發現,使用如下方式的鏈接。在Chrome中點擊後不會做任何跳轉或者打開新標簽頁,但在Firefox下會新開標簽頁。<a href=”JavaScript:void(0);” target=”_blank”>test</a>後經查找資料,發現需如下解決。通過 false;”


