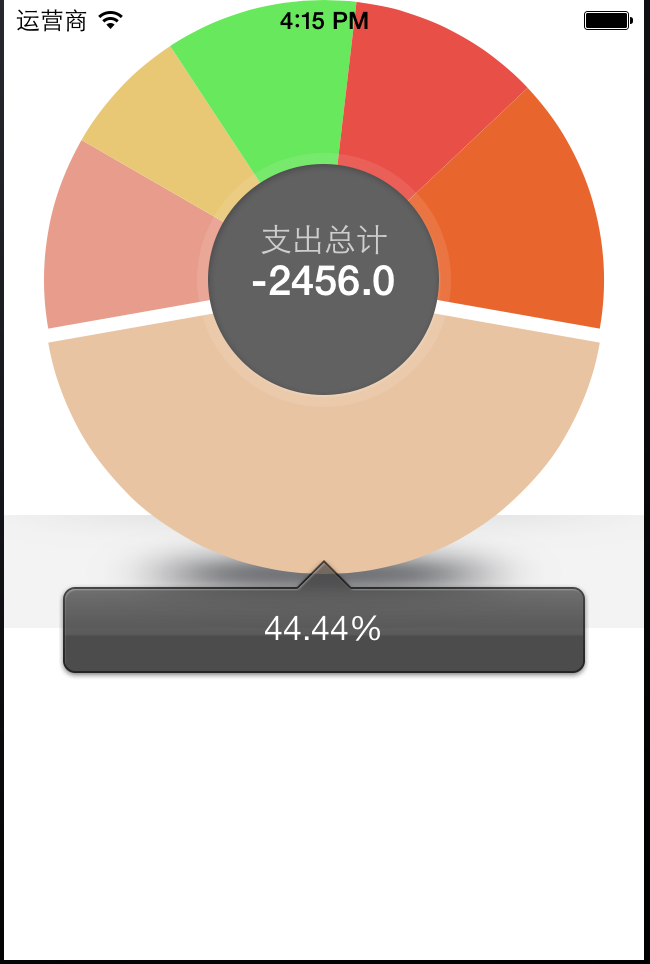
iOS可旋轉的餅圖
效果圖:
餅圖的第三方類在例子中是有的,使用起來也很簡單,下面是使用的程式碼。
ViewController.h
#import <UIKit/UIKit.h>
#import "PieChartView.h"

@interface ViewController : UIViewController<PieChartDelegate>

@property (nonatomic,strong) NSMutableArray *m_valueArray;  //第一組資料的容器
@property (nonatomic,strong) NSMutableArray *m_colorArray; //第一組顏色的容器
@property (nonatomic,strong) NSMutableArray *m_valueArray2;//第二組資料的容器
@property (nonatomic,strong) NSMutableArray *m_colorArray2;//第二組顏色的容器
@property (nonatomic,strong) PieChartView *m_pieChartView; //餅圖類
@property (nonatomic,strong) UIView *m_pieContainer;      //餅圖的容器
@property (nonatomic)BOOL inOut;   //點選中心的控制開關
@property (nonatomic,strong) UILabel *m_selLabel;  //顯示資料的標籤


@end
ViewController.m
//
//  ViewController.m
//  可旋轉的餅圖
//
//  Created by 杜甲 on 14-3-24.
//  Copyright (c) 2014年 杜甲. All rights reserved.
//

#import "ViewController.h"

#define PIE_HEIGHT 280
@interface ViewController ()

@end

@implementation ViewController

- (void)viewDidLoad
{

    self.inOut = YES;
    [super viewDidLoad];
	// Do any additional setup after loading the view, typically from a nib.
    self.m_valueArray = [[NSMutableArray alloc] initWithObjects:
                       [NSNumber numberWithInt:12],
                       [NSNumber numberWithInt:3],
                       [NSNumber numberWithInt:2],
                       [NSNumber numberWithInt:3],
                       [NSNumber numberWithInt:3],
                       [NSNumber numberWithInt:4],
                       nil];
    self.m_valueArray2 = [[NSMutableArray alloc] initWithObjects:
                        [NSNumber numberWithInt:3],
                        [NSNumber numberWithInt:2],
                        [NSNumber numberWithInt:2],
                        nil];


    self.m_colorArray = [NSMutableArray arrayWithObjects:
                       [UIColor colorWithHue:((0/8)%20)/20.0+0.08 saturation:(0%8+3)/10.0 brightness:91/100.0 alpha:1],
                       [UIColor colorWithHue:((1/8)%20)/20.0+0.03 saturation:(1%8+3)/10.0 brightness:91/100.0 alpha:1],
                       [UIColor colorWithHue:((2/8)%20)/20.0+0.12 saturation:(2%8+3)/10.0 brightness:91/100.0 alpha:1],
                       [UIColor colorWithHue:((3/8)%20)/20.0+0.32 saturation:(3%8+3)/10.0 brightness:91/100.0 alpha:1],
                       [UIColor colorWithHue:((4/8)%20)/20.0+0.01 saturation:(4%8+3)/10.0 brightness:91/100.0 alpha:1],
                       [UIColor colorWithHue:((5/8)%20)/20.0+0.05 saturation:(5%8+3)/10.0 brightness:91/100.0 alpha:1],
                       nil];
    self.m_colorArray2 = [[NSMutableArray alloc] initWithObjects:
                        [UIColor purpleColor],
                        [UIColor orangeColor],
                        [UIColor magentaColor],
                        nil];


    //add shadow img
    CGRect pieFrame = CGRectMake((self.view.frame.size.width - PIE_HEIGHT) / 2, 0, PIE_HEIGHT, PIE_HEIGHT);

    UIImage *shadowImg = [UIImage imageNamed:@"shadow.png"];
    UIImageView *shadowImgView = [[UIImageView alloc]initWithImage:shadowImg];
    shadowImgView.frame = CGRectMake(0, pieFrame.origin.y + PIE_HEIGHT*0.92, shadowImg.size.width/2, shadowImg.size.height/2);
    [self.view addSubview:shadowImgView];


    self.m_pieContainer = [[UIView alloc]initWithFrame:pieFrame];
    self.m_pieChartView = [[PieChartView alloc]initWithFrame:self.m_pieContainer.bounds withValue:self.m_valueArray withColor:self.m_colorArray];
    self.m_pieChartView.delegate = self;
    [self.m_pieContainer addSubview:self.m_pieChartView];
    [self.m_pieChartView setAmountText:@"-2456.0"];
    [self.view addSubview:self.m_pieContainer];


    //add selected view
    UIImageView *selView = [[UIImageView alloc]init];
    selView.image = [UIImage imageNamed:@"select.png"];
    selView.frame = CGRectMake((self.view.frame.size.width - selView.image.size.width/2)/2, self.m_pieContainer.frame.origin.y + self.m_pieContainer.frame.size.height, selView.image.size.width/2, selView.image.size.height/2);
    [self.view addSubview:selView];

    self.m_selLabel = [[UILabel alloc]initWithFrame:CGRectMake(0, 24, selView.image.size.width/2, 21)];
    self.m_selLabel.backgroundColor = [UIColor clearColor];
    self.m_selLabel.textAlignment = NSTextAlignmentCenter;
    self.m_selLabel.font = [UIFont systemFontOfSize:17];
    self.m_selLabel.textColor = [UIColor whiteColor];
    [selView addSubview:self.m_selLabel];
    [self.m_pieChartView setTitleText:@"支出總計"];
    self.title = @"對賬單";


}

- (void)selectedFinish:(PieChartView *)pieChartView index:(NSInteger)index percent:(float)per
{
     self.m_selLabel.text = [NSString stringWithFormat:@"%2.2f%@",per*100,@"%"];
}

- (void)onCenterClick:(PieChartView *)pieChartView
{
    self.inOut = !self.inOut;
    self.m_pieChartView.delegate = nil;
    [self.m_pieChartView removeFromSuperview];
    self.m_pieChartView = [[PieChartView alloc]initWithFrame:self.m_pieContainer.bounds withValue:self.inOut?self.m_valueArray:self.m_valueArray2 withColor:self.inOut?self.m_colorArray:self.m_colorArray2];
    self.m_pieChartView.delegate = self;
    [self.m_pieContainer addSubview:self.m_pieChartView];
    [self.m_pieChartView reloadChart];

    if (self.inOut) {
        [self.m_pieChartView setTitleText:@"支出總計"];
        [self.m_pieChartView setAmountText:@"-2456.0"];

    }else{
        [self.m_pieChartView setTitleText:@"收入總計"];
        [self.m_pieChartView setAmountText:@"+567.23"];
    }

}

- (void)viewDidAppear:(BOOL)animated
{
    [self.m_pieChartView reloadChart];
}


- (void)didReceiveMemoryWarning
{
    [super didReceiveMemoryWarning];
    // Dispose of any resources that can be recreated.
}

@end
相關推薦
iOS可旋轉的餅圖
效果圖: 餅圖的第三方類在例子中是有的,使用起來也很簡單,下面是使用的程式碼。 ViewController.h #import <UIKit/UIKit.h> #import "PieChartView.h" @interface ViewCont
JavaScript數據可視化編程學習(一)Flotr2,包含簡單的,柱狀圖,折線圖,餅圖,散點圖
基礎 沒有 cat 勝利 而是 5.4 最好的 表數據 聯系 一、基礎柱狀圖 二、基礎的折線圖 三、基礎的餅圖 四、基礎的散點圖 一、基礎柱狀圖 如果你還沒有想好你的數據用什麽類型的圖表來展示你的數據,你應該首先考慮是否可以做成柱狀圖。柱狀圖可以表示數據的
iOS Tabbar中間新增凸起可旋轉按鈕
前言 最近的專案中有需求在tabbar中間新增凸起按鈕,並且點選時按鈕要旋轉,看了仿閒魚的凸起,點選後是present出來View,而不是像常規的tabbar上新增一個頁面(親測,閒魚的超出Tabbar部分點選是沒有反應的,這是bug啊,下文對這個問題有詳解),所以不符合要求,經過一段摸索最後得的一個
iOS開發示例————使用CAShapeLayer&UIBezierPath繪製資料餅圖
前言借鑑標哥的部落格部分文章:http://www.henishuo.com/ios-cashapelayer-learning/ CAShapeLayer和drawRect的比較: drawRect:屬於CoreGraphics框架,佔用CPU,效能消耗大,不建議重寫CA
iOS 選取圖片 後臺給旋轉 多圖上傳 代理方法不執行
經歷了一個新的專案,也是一個新的團隊.圖片上傳,成了重點.1.圖片上傳伺服器之後,在獲取的時候被旋轉了90度. 解決辦法為:將回調的image物件進行如下處理,if (image.imageOrientation != UIImageOrientationUp)
python可視化---內嵌環形餅圖
auto plt 圖片 san http param ner plot fonts import matplotlib.pyplot as plt import matplotlib as mpl mpl.rcParams["font.sans-serif"]
python可視化---向餅圖中添加表格
難度 nts color font values 技術 學生 text value import matplotlib.pyplot as plt import matplotlib as mpl mpl.rcParams["font.sans-serif"]
Highcharts構建空餅圖
blog 當前 art gravity sdn 增加 avi trac sso Highcharts構建空餅圖 空餅圖就是不包括不論什麽節點的餅圖。在Highcharts中,假設數據列不包括數據,會自己主動顯示空白。這樣瀏覽者無法推斷當前圖表為什麽類型。繪制一個空餅圖
highcharts餅圖
code border owin 技術分享 cti tex http spa att 效果: JSON加載數據: var chartseries2 = [ { name: ‘完成‘ + data.rate + ‘%‘, y: da
ECHARTS柱形圖和餅圖數值顯示
echartsECHARTS柱形圖和餅圖數值顯示,官方文檔寫的很不錯,這裏自己單獨梳理一下,以後可能會用的到。1、柱形圖數值顯示 在option添加: label:{ normal:{ show: true, position: ‘to
DWR(AJAX)+Highcharts繪制曲線圖,餅圖
logging 數據類型 hid 一個 ext js xml 通過 for 源代碼下載 基本需求: 1. 在前臺會用DWR框架(或者AJAX)調用Java後臺代碼獲取要在Hightcharts展示的數據 2. 了解JSON(JavaScript
iOS UI07_導航視圖控制器
nsstring ger creat tco dal role var make uilabel // // MainViewController.m // UI07_導航視圖控制器 // // Created by dllo on 15/8/6.
[SVG實戰]餅圖全面解析
rotate code 處理 半徑 數學 偏移 空格 使用 clas 之前寫過一篇CSS3的餅圖全面解析,這次給大家分享一個SVG實現餅圖的全面解析。 既然是繪制餅圖,那麽顯然需要繪制圓形。 // 一個簡單的圓形,具有一定寬度的描邊。 <svg width=
圖標插件--jqplot實現柱狀圖及餅圖,表盤圖演示樣例
itl nbsp left 柱狀圖 draw ted ner ann name 柱狀圖 在jqPlot圖表插件使用說明(一)中,我們已經能夠通過jqPlot繪制出比較簡單的線形圖。通過查看源碼。我們也能夠看出,線形圖是jqPlot默認的圖表類型:
aNDROID仿支付寶餅圖效果
餅圖 aid hao123 .com andro smart and lis oid sMaRT%E6%BC%82%E4%BA%AE%E6%97%B6%E9%92%9F%E2%80%94%E2%80%94%E6%BA%90%E4%BB%A3%E7%A0%81 http:/
iOS-獲取子視圖父控制器
blog pan control end sna uiview nco 當前 控制 開發中有的時候需要涉及當前視圖的父級視圖,可以通過UIResponder來獲取,有兩種實現方式: UIView *next=sender; while ([next superview]
Echarts餅圖更改顏色、顯示數據且換行
gen val tex png es2017 trigge nbsp charts 代碼 var option = { title : { text: ‘數據來源‘, x:‘center‘ }, tooltip : { tri
QT中給各控件增加背景圖片(可縮放可旋轉)的幾種方法
.net detail eight iou rotate art board 按鈕 previous 1. 給QPushButton 增加背景圖片:背景圖片可根據Button大小自由縮放。 [cpp] view plain copy vo
iOS股票K線圖、校園助手、適配iPhone X、版本檢測等源碼
0.12 適配 環境 cool row 客戶端 1-1 獲取 launch iOS精選源碼 快速創建menuItem控件 YHPhotoBrowser 優化的網絡圖片瀏覽 cocoaAsynSocket demo (包含客戶端和服務端)
利用echarts highcharts 實現自定義地圖 關系圖效果 側邊3D柱形圖餅圖散點圖
技術 ges 散點圖 chart blog 餅圖 git 分享 charts github 地址: https://https://github.com/Gengshaoxuan/medataMap github 地址: https://https://github.c

