MPAndroidChart常見設定屬性(一)——應用層
一丶簡述
上一篇簡單介紹了有關MPAndroidChart,及一些相關得博文連結,並說到了工作上的問題。這一篇就總結一下應用層,如何運用MPAndroidChart
每一篇博文都有自己特點和不足,不可能滿足有所讀者的需求,相同的需求都會不同的UI
二丶MPAndroidChart常見設定屬性(又是選擇性copy)
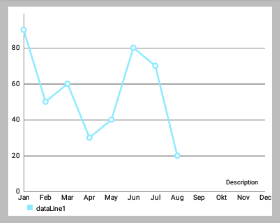
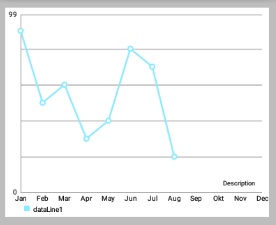
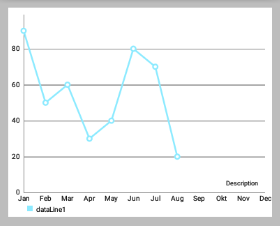
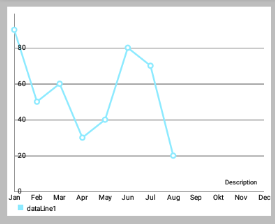
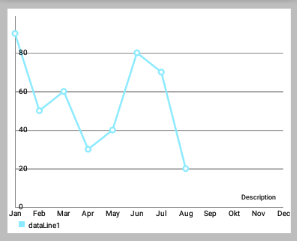
程式碼居然被壓縮了,主要看屬性和效果圖
一、使用
為了使用 LineChart, BarChart, ScatterChart, CandleStickChart, PieChart, BubbleChart or RadarChart ,要在 .xml 檔案定義:
<com.github.mikephil.charting.charts.LineChart
        android:id="@+id/chart"
        android:layout_width="match_parent"
        android:layout_height="match_parent" />
然後在 Activity 或 Fragment 中拿到你定義的 chart:
LineChart chart = (LineChart) findViewById(R.id.chart);使用 java 程式碼建立它(如果不是在佈局檔案中定義,需要將其加入你的佈局):
// programmatically create a LineChart
    LineChart chart = new LineChart(Context);

    // get a layout defined in xml
    RelativeLayout rl = (RelativeLayout) findViewById(R.id.relativeLayout);
    rl.add(chart); // add the programmatically created chart
二、重新整理
- invalidate() : 在chart中呼叫會使其重新整理重繪
- notifyDataSetChanged() : 讓chart知道它依賴的基礎資料已經改變,並執行所有必要的重新計算(比如偏移量,legend,最大值,最小值 …)。在動態新增資料時需要用到。
三、列印日誌
- setLogEnabled(boolean enabled) : 設定為true將啟用chart的logcat輸出。但這不利於效能,如果不是必要的,應保持禁用。
四、基本chart風格
這裡我們先定義一個LineChart範例:
<!--折線圖,layout的背景色為 #bdbdbd 灰-->
        <com.github.mikephil.charting.charts.LineChart
            android:id="@+id/line_chart"
            android:layout_width="match_parent"
            android:layout_height="300dp"
            android:background="#ffffff"
            android:layout_margin="16dp"/>
下面是一些可以直接在 chart 上使用的設定 style 的方法:
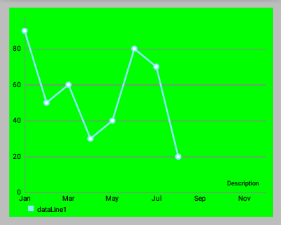
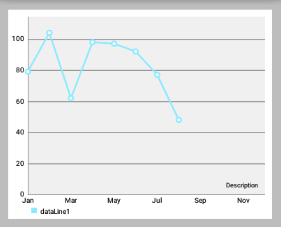
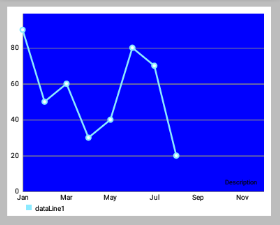
setBackgroundColor(int color): 設定背景顏色,將覆蓋整個圖表檢視。 此外,背景顏色可以在佈局檔案.xml中進行設定。
注意:設定顏色時要ARGB完整的八位(如 0xff00ff00),否則可能會被視為“設定透明顏色”(如 0xff0000)
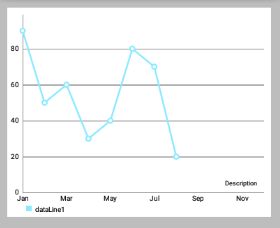
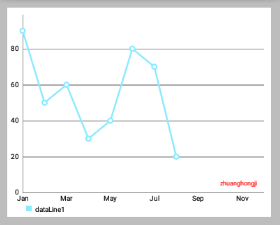
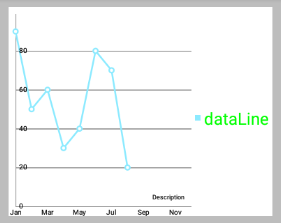
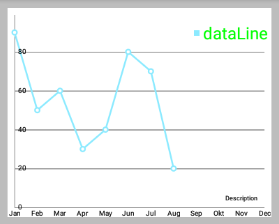
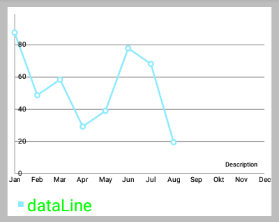
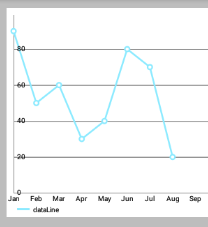
setDescription(String desc): 設定圖表的描述文字,會顯示在圖表的右下角。-
setDescriptionColor(int color): 設定描述文字的顏色。 -
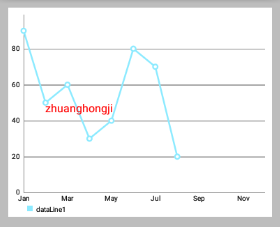
setDescriptionPosition(float x, float y): 自定義描述文字在螢幕上的位置(單位是畫素)。 setDescriptionTypeface(Typeface t): 設定描述文字的 Typeface。-
setDescriptionTextSize(float size): 設定以畫素為單位的描述文字,最小6f,最大16f。 -
setNoDataTextDescription(String desc): 設定當 chart 為空時顯示的描述文字。 -
setDrawGridBackground(boolean enabled): 如果啟用,chart 繪圖區後面的背景矩形將繪製。 -
setGridBackgroundColor(int color): 設定網格背景應與繪製的顏色。 -
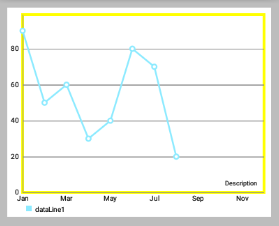
setDrawBorders(boolean enabled): 啟用/禁用繪製圖表邊框(chart周圍的線)。 setBorderColor(int color): 設定 chart 邊框線的顏色。setBorderWidth(float width): 設定 chart 邊界線的寬度,單位 dp。-
-
setMaxVisibleValueCount(int count): 設定最大可見繪製的 chart count 的數量。 只在setDrawValues()設定為true時有效。
啟用/ 禁止 手勢互動
setTouchEnabled(boolean enabled): 啟用/禁用與圖表的所有可能的觸控互動。setDragEnabled(boolean enabled): 啟用/禁用拖動(平移)圖表。setScaleEnabled(boolean enabled): 啟用/禁用縮放圖表上的兩個軸。setScaleXEnabled(boolean enabled): 啟用/禁用縮放在x軸上。setScaleYEnabled(boolean enabled): 啟用/禁用縮放在y軸。setPinchZoom(boolean enabled): 如果設定為true,捏縮放功能。 如果false,x軸和y軸可分別放大。setDoubleTapToZoomEnabled(boolean enabled): 設定為false以禁止通過在其上雙擊縮放圖表。setHighlightPerDragEnabled(boolean enabled): 設定為true,允許每個圖表表面拖過,當它完全縮小突出。 預設值:truesetHighlightPerTapEnabled(boolean enabled): 設定為false,以防止值由敲擊姿態被突出顯示。 值仍然可以通過拖動或程式設計方式突出顯示。 預設值:true
圖表的 拋擲/減速
setDragDecelerationEnabled(boolean enabled): 如果設定為true,手指滑動拋擲圖表後繼續減速滾動。 預設值:true。setDragDecelerationFrictionCoef(float coef): 減速的摩擦係數在[0; 1]區間,數值越高表示速度會緩慢下降,例如,如果將其設定為0,將立即停止。 1是一個無效的值,會自動轉換至0.9999。
高亮
highlightValues(Highlight[] highs): 高亮顯示值,高亮顯示的點選的位置在資料集中的值。 設定null或空陣列則撤消所有高亮。highlightValue(int xIndex, int dataSetIndex): 高亮給定xIndex在資料集的值。 設定xIndex或dataSetIndex為-1撤消所有高亮。getHighlighted(): 返回一個Highlight[]其中包含所有高亮物件的資訊,xIndex和dataSetIndex。
以java程式設計方式使得值高亮不會回撥 OnChartValueSelectedListener .
選擇回撥
MPAndroidChart 提供了許多用於互動回撥的方法,其中 OnChartValueSelectedListener 在點選高亮值時回撥。
public interface OnChartValueSelectedListener {
    /**
    * Called when a value has been selected inside the chart.
    *
    * @param e The selected Entry.
    * @param dataSetIndex The index in the datasets array of the data object
    * the Entrys DataSet is in.
    * @param h the corresponding highlight object that contains information
    * about the highlighted position
    */
    public void onValueSelected(Entry e, int dataSetIndex, Highlight h);
    /**
    * Called when nothing has been selected or an "un-select" has been made.
    */
    public void onNothingSelected();
}
讓你的類實現該介面並設定對 chart 進行監聽,即可接受回撥。
Simply let your class that should receive the callbacks implement this interface and set it as a listener to the chart:
chart.setOnChartValueSelectedListener(this);手勢回撥
監聽器 OnChartGestureListener 可以使得 chart 與手勢操作進行互動。
public interface OnChartGestureListener {

    /**
     * Callbacks when a touch-gesture has started on the chart (ACTION_DOWN)
     *
     * @param me
     * @param lastPerformedGesture
     */
    void onChartGestureStart(MotionEvent me, ChartTouchListener.ChartGesture lastPerformedGesture);

    /**
     * Callbacks when a touch-gesture has ended on the chart (ACTION_UP, ACTION_CANCEL)
     *
     * @param me
     * @param lastPerformedGesture
     */
    void onChartGestureEnd(MotionEvent me, ChartTouchListener.ChartGesture lastPerformedGesture);

    /**
     * Callbacks when the chart is longpressed.
     *
     * @param me
     */
    public void onChartLongPressed(MotionEvent me);

    /**
     * Callbacks when the chart is double-tapped.
     *
     * @param me
     */
    public void onChartDoubleTapped(MotionEvent me);

    /**
     * Callbacks when the chart is single-tapped.
     *
     * @param me
     */
    public void onChartSingleTapped(MotionEvent me);

    /**
     * Callbacks then a fling gesture is made on the chart.
     *
     * @param me1
     * @param me2
     * @param velocityX
     * @param velocityY
     */
    public void onChartFling(MotionEvent me1, MotionEvent me2, float velocityX, float velocityY);

   /**
     * Callbacks when the chart is scaled / zoomed via pinch zoom gesture.
     *
     * @param me
     * @param scaleX scalefactor on the x-axis
     * @param scaleY scalefactor on the y-axis
     */
    public void onChartScale(MotionEvent me, float scaleX, float scaleY);

   /**
    * Callbacks when the chart is moved / translated via drag gesture.
    *
    * @param me
    * @param dX translation distance on the x-axis
    * @param dY translation distance on the y-axis
    */
    public void onChartTranslate(MotionEvent me, float dX, float dY);
}
讓你的類實現該介面並設定對 chart 進行監聽,即可接受回撥。
chart.setOnChartGestureListener(this);設定了監聽器後,chart 會根據你的 setXXXEnable() 進行放縮移動等操作。不用在介面方法裡對圖表進行放縮移動等其他操作,介面方法可以讓你實現其他對應功能,比如說你要列印放縮是的 ScaleX,ScaleY :
@Override
    public void onChartScale(MotionEvent me, float scaleX, float scaleY) {
        Log.i("Scale / Zoom", "ScaleX: " + scaleX + ", ScaleY: " + scaleY);
    }
列印的日誌類似:
I/Gesture: START
I/Scale / Zoom: ScaleX: 1.0, ScaleY: 1.0
I/Scale / Zoom: ScaleX: 1.0, ScaleY: 1.0
I/Scale / Zoom: ScaleX: 1.0174584, ScaleY: 1.0174584
I/Scale / Zoom: ScaleX: 1.240304, ScaleY: 1.240304
I/Scale / Zoom: ScaleX: 1.4446417, ScaleY: 1.4446417
I/Scale / Zoom: ScaleX: 1.5617653, ScaleY: 1.5617653
I/Scale / Zoom: ScaleX: 1.0241176, ScaleY: 1.0241176
I/Scale / Zoom: ScaleX: 1.1038365, ScaleY: 1.1038365
I/Gesture: END, lastGesture: PINCH_ZOOM
下面是練習時寫的一些 OnChartGestureListener 介面實現方法:
@Override
    public void onChartGestureStart(MotionEvent me, ChartTouchListener.ChartGesture lastPerformedGesture) {
        Log.i("Gesture", "START");
    }

    @Override
    public void onChartGestureEnd(MotionEvent me, ChartTouchListener.ChartGesture lastPerformedGesture) {
        Log.i("Gesture", "END, lastGesture: " + lastPerformedGesture);

        // un-highlight values after the gesture is finished and no single-tap
        if (lastPerformedGesture != ChartTouchListener.ChartGesture.SINGLE_TAP)
            mChart.highlightValues(null); // or highlightTouch(null) for callback to onNothingSelected(...)
    }

    @Override
    public void onChartLongPressed(MotionEvent me) {
        Log.i("LongPress", "Chart longpressed.");
    }

    @Override
    public void onChartDoubleTapped(MotionEvent me) {
        Log.i("DoubleTap", "Chart double-tapped.");
    }

    @Override
    public void onChartSingleTapped(MotionEvent me) {
        Log.i("SingleTap", "Chart single-tapped.");
    }

    @Override
    public void onChartFling(MotionEvent me1, MotionEvent me2, float velocityX, float velocityY) {
        Log.i("Fling", "Chart flinged. VeloX: " + velocityX + ", VeloY: " + velocityY);
    }

    @Override
    public void onChartScale(MotionEvent me, float scaleX, float scaleY) {
        Log.i("Scale / Zoom", "ScaleX: " + scaleX + ", ScaleY: " + scaleY);
    }

    @Override
    public void onChartTranslate(MotionEvent me, float dX, float dY) {
        Log.i("Translate / Move", "dX: " + dX + ", dY: " + dY);
    }

    @Override
    public void onValueSelected(Entry e, int dataSetIndex, Highlight h) {
        Log.i("Entry selected", e.toString());
        Log.i("", "low: " + mChart.getLowestVisibleXIndex() + ", high: " + mChart.getHighestVisibleXIndex());
    }

    @Override
    public void onNothingSelected() {
        Log.i("Nothing selected", "Nothing selected.");
    }
}
一、座標軸
1.Document
在文件中,AxisBase是XAxis和YAxis的父類
-
AxisBase
Baseclass of all labels. -
XAxis
Class representing the x-axis labels settings. Only use the setter methods to modify it. Do not access public variables directly. Be aware that not all features the XLabels class provides are suitable for the RadarChart.
X軸標籤設定。只使用setter方法來修改它,不要直接訪問公共變數。請注意,not all features the XLabels class provides are suitable for the RadarChart(對於RadarChart蜘蛛網狀圖不是所有的Xlabels 都適用)。 -
YAxis
Class representing the y-axis labels settings and its entries. Only use the setter methods to modify it. Do not access public variables directly. Be aware that not all features the YLabels class provides are suitable for the RadarChart. Customizations that affect the value range of the axis need to be applied before setting data for the chart.
Y軸標籤設定和它的條目。只使用setter方法來修改它,不要直接訪問公共變數。請注意,not all features the XLabels class provides are suitable for the RadarChart(對於RadarChart蜘蛛網狀圖不是所有的Ylabels 都適用)。在為chart設定 data 之前,影響軸的值範圍的 Customizations 需要先被應用。
2. 概述
下面提及的方法可以適用於兩個軸 。
“軸”類允許特定的Style,由以下 components/parts 組成(可以包含):
- 軸的標籤(y軸垂直繪製 或 x軸水平取向),contain 軸的描述值。
- 所謂
axis-line被直接繪製在便籤旁且平行。 grid-lines在水平方向,且源自每一個軸標籤。LimitLines允許呈現的特別資訊,如邊界或限制。
3. 控制軸的哪些部分被繪製
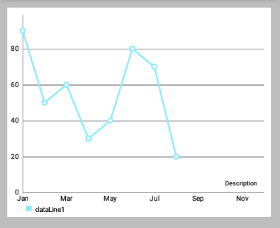
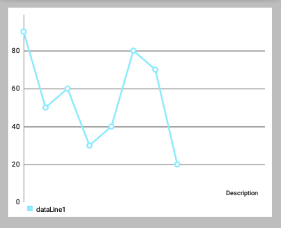
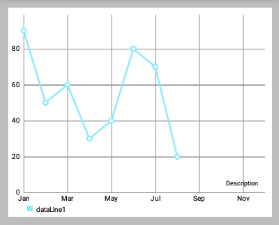
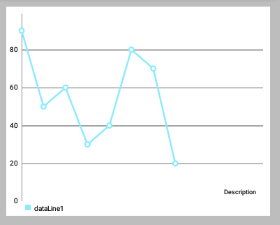
setEnabled(boolean enabled): 設定軸啟用或禁用。如果false,該軸的任何部分都不會被繪製(不繪製座標軸/便籤等)。比如:-
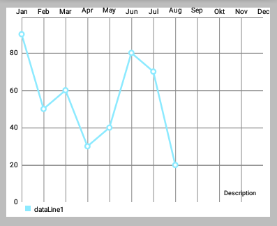
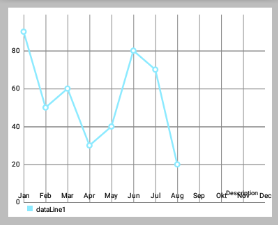
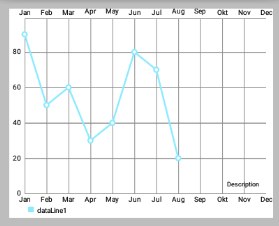
//上面右邊效果圖的部分程式碼,設定X軸
        XAxis xAxis = chart.getXAxis();
        xAxis.setPosition(XAxis.XAxisPosition.BOTTOM); // 設定X軸的位置
//        xAxis.setTypeface(mTf); // 設定字型
        xAxis.setEnabled(false);
        // 上面第一行程式碼設定了false,所以下面第一行即使設定為true也不會繪製AxisLine
        xAxis.setDrawAxisLine(true);

        // 前面xAxis.setEnabled(false);則下面繪製的Grid不會有"豎的線"(與X軸有關)
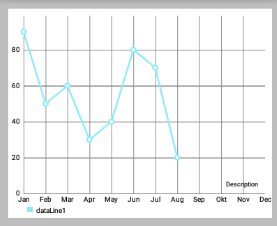
        xAxis.setDrawGridLines(true); // 效果如下圖
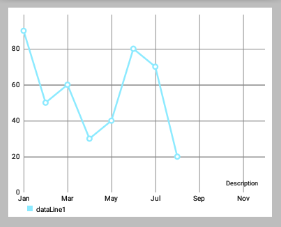
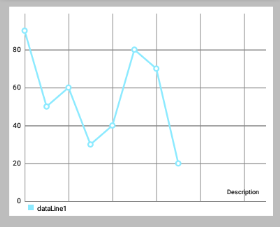
setDrawGridLines(boolean enabled): 設定為true,則繪製網格線。-
 // 上面左邊效果圖的程式碼
        // 兩個都設定為 true
        xAxis.setEnabled(true);
        xAxis.setDrawGridLines(true);

        // 上面右邊效果圖的程式碼
        xAxis.setEnabled(false);
        // xAxis.setEnabled(false);則下面繪製的Grid不會有 "豎的線(與X軸有關)"
        xAxis.setDrawGridLines(true);
-
setDrawAxisLine(boolean enabled): 設定為true,則繪製該行旁邊的軸線(axis-line)。 -
setDrawLabels(boolean enabled): 設定為true,則繪製軸的標籤。
4. Styling / 修改軸
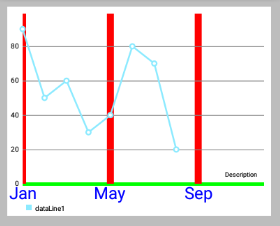
setTextColor(int color): 設定軸標籤的顏色。setTextSize(float size): 設定軸標籤的文字大小。setTypeface(Typeface tf): 設定軸標籤的 Typeface。setGridColor(int color): 設定該軸的網格線顏色。setGridLineWidth(float width): 設定該軸網格線的寬度。setAxisLineColor(int color): 設定軸線的軸的顏色。setAxisLineWidth(float width): 設定該軸軸行的寬度。-
xAxis.setTextColor(Color.BLUE); xAxis.setTextSize(24f); xAxis.setGridLineWidth(10f); xAxis.setGridColor(Color.RED); xAxis.setAxisLineColor(Color.GREEN); xAxis.setAxisLineWidth(5f); -
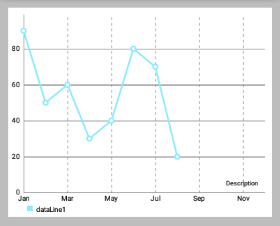
enableGridDashedLine(float lineLength, float spaceLength, float phase): 啟用網格線的虛線模式中得出,比如像這樣“ - - - - - - ”。- “lineLength”控制虛線段的長度
- “spaceLength”控制線之間的空間
- “phase”controls the starting point.
5. 限制線
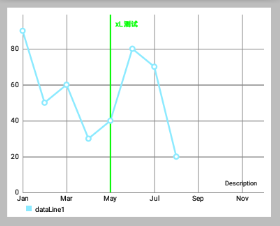
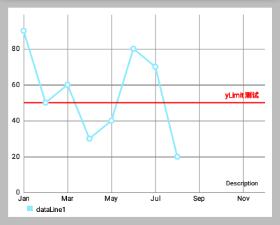
兩個軸支援 LimitLines 來呈現特定資訊,如邊界或限制線。LimitLines 加入到 YAxis 在水平方向上繪製,新增到 XAxis 在垂直方向繪製。 如何通過給定的軸新增和刪除 LimitLines:
addLimitLine(LimitLine l): 給該軸新增一個新的 LimitLine 。removeLimitLine(LimitLine l): 從該軸刪除指定 LimitLine 。- 還有其他的方法進行 新增/刪除 操作。
-
 // 設定x軸的LimitLine,index是從0開始的
        LimitLine xLimitLine = new LimitLine(4f,"xL 測試");
        xLimitLine.setLineColor(Color.GREEN);
        xLimitLine.setTextColor(Color.GREEN);
        xAxis.addLimitLine(xLimitLine);

        // 設定x軸的LimitLine
        LimitLine yLimitLine = new LimitLine(50f,"yLimit 測試");
        yLimitLine.setLineColor(Color.RED);
        yLimitLine.setTextColor(Color.RED);
        // 獲得左側側座標軸
        YAxis leftAxis = chart.getAxisLeft();
        leftAxis.addLimitLine(yLimitLine);
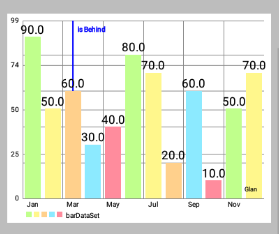
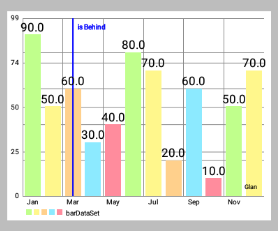
setDrawLimitLinesBehindData(boolean enabled): 控制LimitLines與actual data之間的z-order。 如果設定為 true,LimitLines 繪製在 actual data 的後面,否則在其前面。 預設值:false
// 檢視setLimitLinesBehindData()方法,true或false的效果圖
        LimitLine xLimitLine = new LimitLine(2f,"is Behind");
        xLimitLine.setLineColor(Color.BLUE);
        xLimitLine.setTextColor(Color.BLUE);
        xAxis.addLimitLine(xLimitLine);
        xAxis.setDrawLimitLinesBehindData(true);
//        xAxis.setDrawLimitLinesBehindData(false);
Limit lines(LimitLine類) 用來為使用者提供簡單明瞭的額外資訊。
再舉一個例子,在使用者登入用的應用程式中,圖表可能會顯示各種血壓測量結果。 為了讓使用者知道超過140mmHg 的血壓是被認為是一個健康風險的使用者,可以新增一個 140 的 LimitLine 來提供該資訊。示例程式碼 :
YAxis leftAxis = chart.getAxisLeft();

LimitLine ll = new LimitLine(140f, "血壓偏高");
ll.setLineColor(Color.RED);
ll.setLineWidth(4f);
ll.setTextColor(Color.BLACK);
ll.setTextSize(12f);
// .. and more styling options

leftAxis.addLimitLine(ll);
二、X座標軸
1. 概述
XAxis 類是 AxisBase 的一個子類。 XAxis 類是所有與水平軸相關的 “資料和資訊容器”。
每個 Line-, Bar-, Scatter-, CandleStick- and RadarChart 都有一個 XAxis 物件。 XAxis 物件展示了以 ArrayList<String> 或 String[] ("xVals") 形式遞交給 ChartData 物件的資料。
為了獲得 XAxis 類的例項,可執行以下操作:
XAxis xAxis = chart.getXAxis();2. 自定義軸值
-
setSpaceBetweenLabels(int characters): 設定標籤字元間的空隙,預設characters間隔是4 。 -
setLabelsToSkip(int count): 設定在”繪製下一個標籤”時,要忽略的標籤數。 This will disable the feature that automatically calculates an adequate space between the axis labels and set the number of labels to be skipped to the fixed number provided by this method. CallresetLabelsToSkip(...)to re-enable automatic calculation. -
resetLabelsToSkip(): 呼叫這個方法將使得通過setLabelsToSkip(...)的“忽略效果”失效 while drawing the x-axis. Instead, the number of values to skip will again be calculated automatically. -
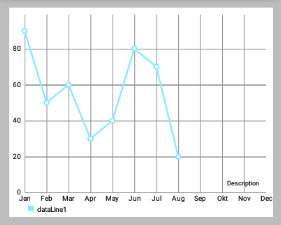
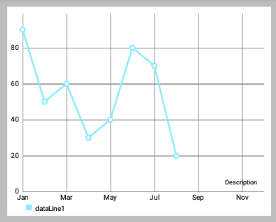
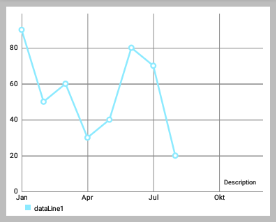
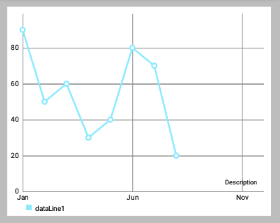
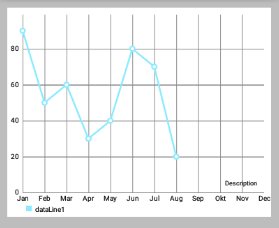
// 上面左圖的程式碼
    xAxis.setLabelsToSkip(4);
    // xAxis.resetLabelsToSkip();

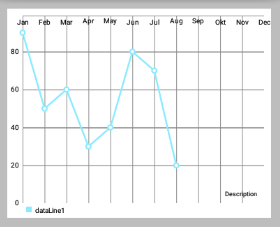
    // 上面右圖的程式碼,會發現 xAxis.setLabelsToSkip(4); 的效果並沒有出現
    xAxis.setLabelsToSkip(4);
    xAxis.resetLabelsToSkip();
-
setAvoidFirstLastClipping(boolean enabled): 如果設定為true,則在繪製時會避免“剪掉”在x軸上的圖表或螢幕邊緣的第一個和最後一個座標軸標籤項。 -
setPosition(XAxisPosition pos): 設定XAxis出現的位置。TOP,BOTTOM,TOP_INSIDE,BOTTOM_INSIDE或BOTH_SIDED。 (從左到右,從上到下,對應下圖)
3. 格式化值
setValueFormatter(XAxisValueFormatter formatter)設定自定義格式,在繪製之前動態調整x的值。
4. 範例程式碼
XAxis xAxis = chart.getXAxis();
xAxis.setPosition(XAxisPosition.BOTTOM);
xAxis.setTextSize(10f);
xAxis.setTextColor(Color.RED);
xAxis.setDrawAxisLine(true);
xAxis.setDrawGridLines(false);
// set a custom value formatter
xAxis.setXValueFormatter(new MyCustomFormatter());
// and more...
三、Y軸
1. 概述
YAxis 是 AxisBase 的一個子類。
YAxis 類是一切與垂直軸相關的資料和資訊的容器。 每個 Line-, Bar-, Scatter or CandleStickChart 都有 left 和 right 的 YAxis 的物件,分別在左右兩邊。 但是 RadarChart 只有一個 YAxis 。 預設情況下,圖表的兩個軸都被啟用,並且將被繪製。
通過以下方法可獲得 YAxis 類例項 :
YAxis leftAxis = chart.getAxisLeft();
YAxis rightAxis = chart.getAxisRight();

YAxis leftAxis = chart.getAxis(AxisDependency.LEFT);

YAxis yAxis = radarChart.getYAxis(); // this method radarchart only
在執行時,使用 public AxisDependency getAxisDependency() 方法以確定此軸表示圖表的側面。
2. 自定義軸值
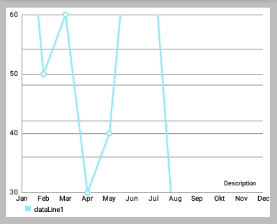
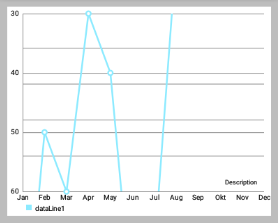
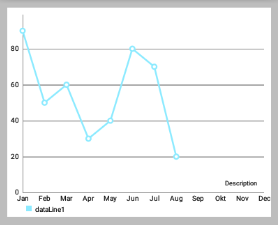
setStartAtZero(boolean enabled): 設定為 true,則無論圖表顯示的是哪種型別的資料,該軸最小值總是0 。setAxisMaxValue(float max): 設定該軸的最大值。 如果設定了,這個值將不會是根據提供的資料計算出來的。resetAxisMaxValue(): 呼叫此方法撤銷先前設定的最大值。 通過這樣做,你將再次允許軸自動計算出它的最大值。setAxisMinValue(float min): 設定該軸的自定義最小值。 如果設定了,這個值將不會是根據提供的資料計算出來的。resetAxisMinValue(): 呼叫此撤銷先前設定的最小值。 通過這樣做,你將再次允許軸自動計算它的最小值。-
// 上面的右圖是以下程式碼設定後的效果圖 leftAxis.setStartAtZero(false); leftAxis.setAxisMinValue(30); leftAxis.setAxisMaxValue(60); -
setInverted(boolean enabled): 如果設定為true,該軸將被反轉,這意味著最高值將在底部,頂部的最低值。 -
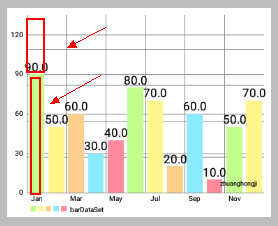
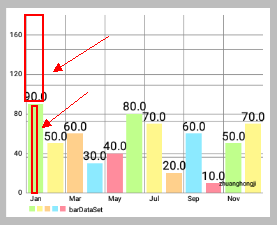
setSpaceTop(float percent): 設定圖表中的最高值的頂部間距佔最高值的值的百分比(設定的百分比 = 最高柱頂部間距/最高柱的值)。預設值是10f,即10% 。 -
// 上面左圖,間距長度是值長度的50%,間距長度是值長度的二分之一
    leftAxis.setSpaceTop(20f);

    // 上面左圖,間距長度是值長度的100%,即兩者相等
    leftAxis.setSpaceTop(100f);
-
setSpaceBottom(float percent): Sets the bottom spacing (in percent of the total axis-range) of the lowest value in the chart in comparison to the lowest value on the axis. -
setLabelCount(int count, boolean force): 設定y軸的標籤數量。 請注意,這個數字是不固定if(force == false),只能是近似的。 如果if(force == true),則確切繪製指定數量的標籤,但這樣可能導致軸線分佈不均勻。 setShowOnlyMinMax(boolean enabled): 如果啟用,該軸將只顯示它的最小值和最大值。 如果force == true這可能會被忽略/覆蓋。-
// 上面的左圖
    leftAxis.setLabelCount(5, false);
    leftAxis.setShowOnlyMinMax(true);

    // 上面的右圖
    leftAxis.setLabelCount(5, false);
    leftAxis.setShowOnlyMinMax(true);
setPosition(YAxisLabelPosition pos): 設定,其中軸標籤繪製的位置。 無論是OUTSIDE_CHART或INSIDE_CHART。
為圖表設定資料前,影響圖表軸所需的值範圍要先定義好。
3. 自定義格式的軸標籤
setValueFormatter(YAxisValueFormatterf): 設定該軸的自定義 ValueFormatter 。 該介面允許 格式化/修改 原來的標籤文字,返回一個自定義的文字。
4. 示例程式碼
YAxis yAxis = mChart.getAxisLeft();
yAxis.setTypeface(...); // set a different font
yAxis.setTextSize(12f); // set the textsize
yAxis.setAxisMaxValue(100f); // the axis maximum is 100
yAxis.setTextColor(Color.BLACK);
yAxis.setValueFormatter(new MyValueFormatter());
yAxis.setLabelCount(6, false);
//... and more
一、ChartData 類
為了讓大家更容易理解,這裡先簡單介紹下 MPAndroidChart 的資料模型 ChartData 。後面有文章再詳細介紹該圖示庫的其它資料型別。
ChartData 類是所有資料類的基類,比如 LineData,BarData 等,它是用來為 Chart 提供資料的,通過 setData(ChartData data){...} 方法。
public class LineData extends ChartData { ...以下提到的方法是在 ChartData 類中被實現,因此可用於所有子類。
1. Styling data
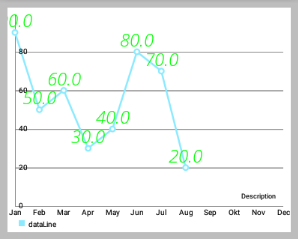
setDrawValues(boolean enabled): 啟用/禁用 繪製所有DataSets資料物件包含的資料的值文字。setValueTextColor(int color): 設定DataSets資料物件包含的資料的值文字的顏色。setValueTextSize(float size): 設定DataSets資料物件包含的資料的值文字的大小(單位是dp)。-
//LineDataSet可以看做是一條線
    LineDataSet dataSet = new LineDataSet(entryList, "dataLine");
    dataSet.setLineWidth(2.5f);
    dataSet.setCircleSize(4.5f);
    dataSet.setHighLightColor(Color.RED); // 設定點選某個點時,橫豎兩條線的顏色
    dataSet.setDrawValues(true); // 是否在點上繪製Value
    dataSet.setValueTextColor(Color.GREEN);
    dataSet.setValueTextSize(12f);
    allLinesList.add(dataSet);
setValueTypeface(Typeface tf): 設定Typeface的所有價值標籤的所有DataSets這些資料物件包含。
 dataSet.setValueTextSize(24f);
        allLinesList.add(dataSet);

        // 設定上面左圖的字型
        Typeface tf1 = Typeface.createFromAsset(getAssets(), "OpenSans-BoldItalic.ttf");
        dataSet.setValueTypeface(tf1);

        // 設定上面右圖的字型
        Typeface tf2 = Typeface.createFromAsset(getAssets(), "OpenSans-LightItalic.ttf");
        dataSet.setValueTypeface(tf2);
setValueFormatter(ValueFormatter f): 為DataSets資料物件包含的資料設定自定義的ValueFormatter。
2. Getters / Convenience
getDataSetByIndex(int index): 返回目標DataSet列表中給定索引的資料物件。contains(Entry entry): 檢查此資料物件是否包含指定的Entry 。 注:這個相當影響效能,效能嚴峻情況下,不要過度使用。contains(T dataSet): Returns true if this data object contains the provided DataSet , false if not.
3. Clear
clearValues(): 清除所有DataSet物件和所有Entries的資料 。 不會刪除所提供的x-values。
4, 選中高亮
setHighlightEnabled(boolean enabled): 設定為true,允許通過點選高亮突出ChartData物件和其DataSets。
二、設定資料
1. 概述
如果你想為圖表新增資料,你可以通過下面這個方法:
public void setData(ChartData data) { ... }基類 ChartData 封裝了渲染過程中所需要的圖表中的所有資料和資訊。 對於每種型別的圖表,不同的 ChartData 子類(例如 LineData)應該被用於為圖表設定資料。 在建構函式中,你可以通過 ArrayList<? extends DataSet> 作為要顯示的值,一個額外 ArrayList 的 String 用來描述 x 軸上的標籤。 例如,通過 LineData 將資料新增到一個 LineChart :
public LineData(ArrayList<String> xVals, ArrayList<LineDataSet> sets) { ... }那麼,DataSet 到底是什麼和為什麼你會需要它? 很簡單,一個 DataSet 物件代表一組 entries(資料型別 Entry),在圖表內屬於一個整體。 它在圖表中被設計成 邏輯上分離的不同組的值 。 每種型別的圖表,通過一個不同的 DataSet 物件(如 LineDataSet)來做出特定的 style 。
2. 舉個例子
你可能想用 LineChart 來 顯示兩個不同公司一年的季度收入 。在這種情況下,將建議建立兩個不同的 LineDataSet 物件,每個包含四個值(四個季度)。 用一個 ArrayList 描述在x軸上的標籤,您只需提供四個 String : “第一季度”,“第二季度”,“第三季度”,“第四季度” 。
當然,也有可能只提供一個包含兩個公司的所有8個值的 LineDataSet 物件。
那麼,如何建立一個 LineDataSet 物件?
// LineDataSet 類的原始碼
public class LineDataSet extends LineRadarDataSet<Entry> {
    ....
    public LineDataSet(List<Entry> yVals, String label) {
        super(yVals, label);

        // mCircleSize = Utils.convertDpToPixel(4f);
        // mLineWidth = Utils.convertDpToPixel(1f);

        mCircleColors = new ArrayList<Integer>();

        // default colors
        // mColors.add(Color.rgb(192, 255, 140));
        // mColors.add(Color.rgb(255, 247, 140));
        mCircleColors.add(Color.rgb(140, 234, 255));
    }
    ....
}
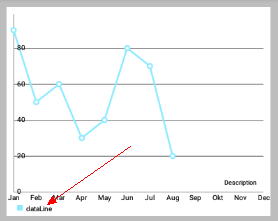
在建構函式中,很明顯 LineDataSet 需要一個 Entry 的 ArrayList 引數,和一個 String 引數作為 圖例 (Legend)的 label 來描述 LineDataSet 。 此外, this label can be used to find the LineDataSet amongst other LineDataSet objects in the LineData object.
該 Entry 型別的 ArrayList 封裝了圖表所有的值。 Entry 相當一個容器,用來封裝並儲存“一對值”,and it’s position on the x-axis (the index inside the ArrayList of String of the LineData object the value is mapped to ) :
public Entry(float val, int xIndex) { ... }3. 還是用之前的例子
以前面提到的(這兩家公司一年的季度營收)為例:
0) 總的資料包含和操作類似:
// 假設是為 LineChart 設定資料,資料操作順序大概如下:
new Entry(float val, int xIndex);
new ArrayList<Entry>();

new LineDataSet(ArrayList<Entry> , "label");
new ArrayList<LineDataSet>();

new LineData(List<String> xVals, List<LineDataSet> dataSets));
chart.setData(LineData);
// 詳細步驟繼續往下看
1) 首先,建立型別的列表Entry ,將保留您的值:
 ArrayList<Entry> valsComp1 = new ArrayList<Entry>();
    ArrayList<Entry> valsComp2 = new ArrayList<Entry>();
2) 然後,給 lists 集合新增 Entry 物件。
確保 Entry 物件包含的 index 都是正確的 (對於x軸來說)。
Entry c1e1 = new Entry(100.000f, 0); // 0 == quarter 1
    valsComp1.add(c1e1);
    Entry c1e2 = new Entry(50.000f, 1);  // 1 == quarter 2 ...
    valsComp1.add(c1e2);
    // and so on ...

    Entry c2e1 = new Entry(120.000f, 0); // 0 == quarter 1
    valsComp2.add(c2e1);
    Entry c2e2 = new Entry(110.000f, 1); // 1 == quarter 2 ...
    valsComp2.add(c2e2);
    //...
3) 現在,有了 Entry 物件的 lists 集合,再建立 LineDataSet 物件:
 LineDataSet setComp1 = new LineDataSet(valsComp1, "Company 1");
    setComp1.setAxisDependency(AxisDependency.LEFT);
    LineDataSet setComp2 = new LineDataSet(valsComp2, "Company 2");
    setComp2.setAxisDependency(AxisDependency.LEFT);
通過呼叫 setAxisDependency(...) 使得 DataSet 對應指定軸,進行繪製。
4) 通過 DataSets 集合和 x-axis entries 集合,來建立我們的 ChartData 物件:
//  public LineData(List<String> xVals, List<LineDataSet> dataSets) {
//        super(xVals, dataSets);
//  }

    ArrayList<LineDataSet> dataSets = new ArrayList<LineDataSet>();
    dataSets.add(setComp1);
    dataSets.add(setComp2);

    ArrayList<String> xVals = new ArrayList<String>();
    xVals.add("1.Q"); xVals.add("2.Q"); xVals.add("3.Q"); xVals.add("4.Q");

    LineData data = new LineData(xVals, dataSets);
    mLineChart.setData(data);
mLineChart.invalidate(); // refresh- 呼叫
invalidate()後圖表被重新整理,所提供的資料重新繪製。
三、設定顏色
1. ColorTemplate 類簡介
- Class that holds predefined color integer arrays (e.g. ColorTemplate.VORDIPLOM_COLORS) and convenience methods for loading colors from resources.
該類封裝有 預定義的顏色整數陣列(例如ColorTemplate.VORDIPLOM_COLORS)和便利的從資源載入顏色的方法。 ColorTemplate類的原始碼
public class ColorTemplate {

    /**
     * an "invalid" color that indicates that no color is set
     */
    public static final int COLOR_NONE = -1;

    /**
     * this "color" is used for the Legend creation and indicates that the next
     * form should be skipped
     */
    public static final int COLOR_SKIP = -2;

    /**
     * THE COLOR THEMES ARE PREDEFINED (predefined color integer arrays), FEEL
     * FREE TO CREATE YOUR OWN WITH AS MANY DIFFERENT COLORS AS YOU WANT
     */
    public static final int[] LIBERTY_COLORS = {
            Color.rgb(207, 248, 246), Color.rgb(148, 212, 212), Color.rgb(136, 180, 187),
            Color.rgb(118, 174, 175), Color.rgb(42, 109, 130)
    };
    public static final int[] JOYFUL_COLORS = {
            Color.rgb(217, 80, 138), Color.rgb(254, 149, 7), Color.rgb(254, 247, 120),
            Color.rgb(106, 167, 134), Color.rgb(53, 194, 209)
    };
    public static final int[] PASTEL_COLORS = {
            Color.rgb(64, 89, 128), Color.rgb(149, 165, 124), Color.rgb(217, 184, 162),
            Color.rgb(191, 134, 134), Color.rgb(179, 48, 80)
    };
    public static final int[] COLORFUL_COLORS = {
            Color.rgb(193, 37, 82), Color.rgb(255, 102, 0), Color.rgb(245, 199, 0),
            Color.rgb(106, 150, 31), Color.rgb(179, 100, 53)
    };
    public static final int[] VORDIPLOM_COLORS = {
            Color.rgb(192, 255, 140), Color.rgb(255, 247, 140), Color.rgb(255, 208, 140),
            Color.rgb(140, 234, 255), Color.rgb(255, 140, 157)
    };

    /**
     * Returns the Android ICS holo blue light color.
     *
     * @return
     */
    public static int getHoloBlue() {
        return Color.rgb(51, 181, 229);
    }

    /**
     * turn an array of resource-colors (contains resource-id integers) into an
     * array list of actual color integers
     *
     * @param r
     * @param colors an integer array of resource id's of colors
     * @return
     */
    public static List<Integer> createColors(Resources r, int[] colors) {

        List<Integer> result = new ArrayList<Integer>();

        for (int i : colors) {
            result.add(r.getColor(i));
        }

        return result;
    }

    /**
     * Turns an array of colors (integer color values) into an ArrayList of
     * colors.
     *
     * @param colors
     * @return
     */
    public static List<Integer> createColors(int[] colors) {

        List<Integer> result = new ArrayList<Integer>();

        for (int i : colors) {
            result.add(i);
        }

        return result;
    }
}
當時自從 MPAndroidChart V1.4.0 之後,ColorTemplate 這個類就不再重要了。我們可以直接通過 DataSet 物件進行指定顏色,從而可以區分每個 DataSet 的 Style 。
2. 舉例說明
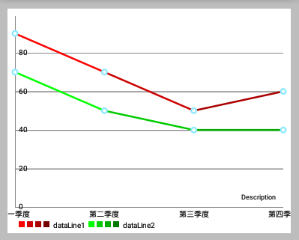
還是用公司季度營收的例子,我們有兩個不同的 LineDataSet 代表兩家公司,為此我們現在要設定不同的顏色。
我們希望:
- “公司1” 的顏色用四種不同變化“紅”來表示
- “連隊2” 的顏色用四種不同變化“綠”來表示
- (效果如下面效果圖的右圖,左圖是單色的)
效果圖如下所示: 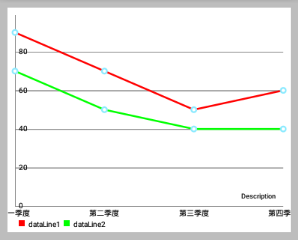
ArrayList<LineDataSet> allLinesList = new ArrayList<LineDataSet>();
    //LineDataSet可以看做是一條線
    LineDataSet dataSet1 = new LineDataSet(entryList1, "dataLine1");
    LineDataSet dataSet2 = new LineDataSet(entryList2, "dataLine2");

    // 上面左效果圖的程式碼
    // dataSet1.setColor(Color.RED);
    // dataSet2.setColor(Color.GREEN);

    // sets colors for the dataset,
    // resolution of the resource name to a "real" color is done internally
    dataSet1.setColors(new int[]{R.color.red1, R.color.red2, R.color.red3,
        R.color.red4}, context);
    dataSet2.setColors(new int[]{R.color.green1, R.color.green2, R.color.green3,
        R.color.green4}, context);

    allLinesList.add(dataSet1);
    allLinesList.add(dataSet2);

    List<String> quarterStrs = new ArrayList<String>();
    quarterStrs.add("第一季度");
    quarterStrs.add("第二季度");
    quarterStrs.add("第三季度");
    quarterStrs.add("第四季度");
    //LineData表示一個LineChart的所有資料(即一個LineChart中所有折線的資料)
    LineData mChartData = new LineData(quarterStrs, allLinesList);
除此之外,還有很多其他的方法來設定 DataSet 的顏色 。 下面是完整的文件:
-
setColors(int [] colors, Context c): 設定該 DataSet 的顏色。
您可以使用new int[] {R.color.red,R.color.green,...}使得顏色值可以重用。 在內部,顏色是使用getResources().getColor(...)來實現獲取的。 -
setColors(int [] colors): 設定該 DataSet 的顏色。Colors are reused as soon as the number of Entries the DataSet represents is higher than the size of the colors array. Make sure that the colors are already prepared (by callinggetResources().getColor(...))before adding them to the DataSet. -
setColors(ArrayList<Integer> colors): 設定該 DataSet 的顏色。Sets the colors that should be used fore this DataSet. Colors are reused as soon as the number of Entries the DataSet represents is higher than the size of the colors array. Make sure that the colors are already prepared (by callinggetResources().getColor(...))before adding them to the DataSet. -
setColor(int color): 設定該資料集 唯一的顏色。 在內部,實現方式類似上面的”顏色陣列”,只不過”顏色陣列都是同一種顏色”
3. ColorTemplate 的使用例子:
LineDataSet set = new LineDataSet(...);
set.setColors(ColorTemplate.VORDIPLOM_COLORS);- 如果沒有為
DataSet設定顏色,則使用預設顏色。
一、概述
本章將重點介紹各個圖表型別特定的設定。
預設情況下,所有的圖表型別都支援 Legend 且在設定圖表資料後會自動生成 Legend 。 Legend 通常由一個標籤的 形式/形狀 來表示多個條目( entries ) 的每一個。
entries 數量自動生成的 legend 取決於DataSet 的標籤 不同顏色的數量(在所有 DataSet 的物件)。 Legend 的標籤取決於圖表中所使用的 DataSet物件。 如果沒有為 DataSet 物件指定標籤,圖表將自動生成它們。 如果多個顏色用於一個 DataSet ,這些顏色分類 ,只通過一個標籤說明。
對於定製的 Legend ,可以通過圖表物件的 getLegend() 方法先獲取 Legen 在進行呼叫對應方法:
Legend legend = chart.getLegend();二、是否繪製 Legend
setEnabled(boolean enabled): 設定Legend啟用或禁用。 如果禁用,Legend將不會被繪製。
三、修改 Legend
setTextColor(int color): 設定圖例標籤的顏色。-
setTextSize(float size): 設定在DP傳說標籤的文字大小。
單位是”畫素” min = 6f, max = 24f, default 10f -
setTypeface(Typeface tf): 設定自定義Typeface圖例標籤。
四、Wrapping / clipping avoidance
setWordWrapEnabled(boolean enabled): 如果啟用,Legend 的內容將不會超出圖表邊界之外,而是建立一個新的行。 請注意,這會降低效能和僅適用於”legend 位於圖表下面”的情況。setMaxSizePercent(float maxSize): 設定最大圖例的百分比(相對整個圖表大小)。 預設值:0.95f(95%)
五、自定義 Legend
-
setPosition(LegendPosition pos): 通過 LegendPosition 設定 Legend 出現的位置。RIGHT_OF_CHARTRIGHT_OF_CHART_CENTERRIGHT_OF_CHART_INSIDEBELOW_CHART_LEFTBELOW_CHART_RIGHTBELOW_CHART_CENTERPIECHART_CENTER(PieChart獨有)等等。
-
setFormSize(float size): 設定 legend-forms 的大小,單位dp。 setForm(LegendForm shape): 設定LegendForm。This is the shape that is drawn next to the legend-labels with the color of the DataSet the legend-entry represents. 正方形,圓形或線。
legend.setFormSize(18f);
        legend.setForm(Legend.LegendForm.SQUARE);
        legend.setForm(Legend.LegendForm.CIRCLE);
        legend.setForm(Legend.LegendForm.LINE);
setXEntrySpace(float space): 設定在水平軸上legend-entries的間隙。setYEntrySpace(float space): 設定在垂直軸上legend-entries的間隙。setFormToTextSpace(float space): 設定legend-form和legend-label之間的空間。setWordWrapEnabled(boolean enabled): 設定 Legend 是否自動換行? 目前僅支援BelowChartLeft,BelowChartRight,BelowChartCenter。 / you may want to set maxSizePercent when word wrapping, to set the point where the text wraps.
六、設定自定義標籤和顏色
setCustom(int[] colors, String[] labels): 設定自定義Legend的標籤和顏色。 顏色數應該匹配標籤數,並且相對應。A null label will start a group. A (-2) color will avoid drawing a form This will disable the feature that automatically calculates the legend labels and colors from the datasets. 呼叫resetCustom()重新啟用自動計算(and then notifyDataSetChanged() is needed to auto-calculate the legend again)。resetCustom(): 呼叫此將禁用通過setCustom(...)方法自定義的圖例標籤。在notifyDataSetChanged()被呼叫後,標籤將再次被自動計算。setExtra(int[] colors, String[] labels): Sets colors and labels that will be appended to the end of the auto calculated colors and labels arrays after calculating the legend. (if the legend has already been calculated, you will need to callnotifyDataSetChanged()to let the changes take effect)
七、程式碼範例
 Legend l = chart.getLegend();
    l.setFormSize(10f); // set the size of the legend forms/shapes
    l.setForm(LegendForm.CIRCLE); // set what type of form/shape should be used
    l.setPosition(LegendPosition.BELOW_CHART_LEFT);
    l.setTypeface(...);
    l.setTextSize(12f);
    l.setTextColor(Color.BLACK);
    l.setXEntrySpace(5f); // set the space between the legend entries on the x-axis
    l.setYEntrySpace(5f); // set the space between the legend entries on the y-axis

    // set custom labels and colors
    l.setCustom(ColorTemplate.VORDIPLOM_COLORS,
            new String[] { "Set1", "Set2", "Set3", "Set4", "Set5" });

    // and many more...
寫在最後微信掃碼提問
相關推薦
MPAndroidChart常見設定屬性(一)——應用層
一丶簡述 上一篇簡單介紹了有關MPAndroidChart,及一些相關得博文連結,並說到了工作上的問題。這一篇就總結一下應用層,如何運用MPAndroidChart 每一篇博文都有自己特點和不足,不可能滿足有所讀者的需求,相同的需求都會不同的UI 二丶MPA
自動設定紋理資源屬性(一)
實際專案中,我們會對指定的紋理設定不同平臺不同屬性。手動去設定操作量相對較大特別是資源持續性迭代的情況下,所以為了目標需求,我們需要去製作一個工具來設定我們匯入的紋理資源。 目標1:獲取匯入的紋理資源,並修改紋理資源屬性。可用介面:AssetPostprocessor;T
WPF入門教程系列十一——依賴屬性(一)
nts 如果 edev 出現 樣式 語法 寫法 屬性。 結構 一、依賴屬性基本介紹 本篇開始學習WPF的另一個重要內容依賴屬性。 大家都知道WPF帶來了很多新的特性,其中一個就是引入了一種新的屬性機制——依賴屬性。依賴屬性出現的目的是用來實現WPF中的樣式、自
Linux基礎之常見命令用法(一)
linux基礎命令入門(一)一、Linux文件目錄結構 在講述之前,先簡短的說說Windows文件結構,打開‘計算機’,看到的一個個的驅動器(盤符,例C盤、D盤等),點開其中任意盤符,看到的是一個個文件或文件夾,繼續打開...,每個盤都有自己的根目錄。若是把其打開過程畫下來,便可得到如下多棵倒樹並列的圖
Java常見錯誤整理(一)
最新 java虛擬機 home 64位安裝 .cn www. 錯誤 jdk8 image 1、配置完Java環境變量之後,仍然不能使用java命令。 解決方法: 如果是Windows10系統出現此問題,是因為個別Windows10系統不識別“JAVA_HOME”環
js常見算法(一)
min replicat subst 解析url class ati ali console maximum 1.每個單詞手字母大寫 var capitalizeEveryWord = str => str.replace(/\b[a-z]/g, char =>
HTML常用元素和屬性(一)
鍵盤 set res html 5 格式 stc down 下標 術語 1:基礎元素 <!--..-->定義註釋 <html>根元素 <head>頁面頭部分 <title>頁面標題 <body>主題部分,屬性可以指
漫畫 | Redis常見面試問題(一)
性能 lse java7 一場 str 歷史 float host import 最近,阿音在為接下來的一場面試做準備,其中的內容包括redis,而且redis是重點內容。 Redis是一個開源的使用ANSI C語言編寫、支持網絡、可基於內存亦可持久化的日誌型、Key-Va
機器學習中 常見問題彙總(一)
深度學習框架TensorFlow中都有哪些優化方法? 梯度下降演算法針對凸優化問題原則上是可以收斂到全域性最優的,因為此時只有唯一的區域性最優點。而實際上深度學習模型是一個複雜的非線性結構,一般屬於非凸問題,這意味著存在很多區域性最優點(鞍點),採用梯度下降演算法可能會陷入
java常見面試題目(一)
過程 重寫 font ble body 釋放 就會 t對象 使用 在大四實習階段,秋招的時候,面試了很多家公司,總結常見的java面試題目:(答案可以自己百度) 1、你所用oracle的版本號是多少? 2、tomcat修改8080端口號的配置文件是哪個? 3、mybati
初學者學演演算法|從時間複雜度認識常見演演算法(一)
O(log n):二分搜尋法時間複雜度為 O(log n) 的演演算法(這邊的 log 都是以二為底),代表當輸入的數量是 n 時,執行的步驟數會是 log n。(讓忘記 log 是什麼的同學們複習一下,當 log n = x 的意思是 n = 2^x,如果這部分的腦細胞尚未復活,且讓我們先記住 n = 2^
影象處理工具包ImagXpress常見問題解答(一)
ImagXpress是一組影象處理庫,可將影象處理新增到Windows應用程式中。此成像SDK通過藉助影象編輯,轉換,壓縮和顏色調整等功能,以及易於實現的程式碼和全面的程式碼示例可輕鬆新增影象處理和操作到Windows應用程式。ImagXpress的優點: 數十種影象處理功能 易於
# CSS佈局常見問題總結(一)
margin水平居中的使用 margin: 0 auto; 目標元素為塊級元素,並且設定寬度,沒有寬度預設為100%,這會導致沒有auto值 vertical-align的使用(垂直對齊方式) vertical-align設定行內元素垂直對齊方式,對塊
中介軟體--訊息中介軟體(一)應用背景和場景
背景: 應用整合面臨的幾個問題: 1.網路是不可靠的 2.分散式下網路的速度不足夠的快 3.任何兩端的應用可能是不同的,應用實現方式、語言,不同資料格式等 4.應用隨著需求改變難以避免,整合的
Docker實踐(一)應用場景和安裝
隨著網際網路的發展,容器技術越來越得到大規模應用廠家的重視。Docker作為paas平臺的容器,最近幾年引起眾多技術人士的關注,並且也越來越流行。 一、Docker是什麼 Docker 是一個開源的
效能測試常見的指標(一)
效能測試最基本要考慮以下幾點: 1、時間特性,主要指的是軟體產品的事物響應時間(使用者發出請求到收到應答的這段時間) 2、資源利用率,包括:cpu、記憶體、網路、硬碟、虛擬記憶體(如Java虛擬機器) 3、伺服器可靠性,指伺服器能在相對高負載情況下持續的執行 4、可配置優化性,指伺服器
前端———CSS3一些不常用卻實用的屬性(一)
一.transparent:隱藏邊框線,這裡是隱藏了右邊的邊框線,其他 left top bottom 一樣的操作 二丶**.opaciiy** 元素的不透明: 把整個元素都能設定為透明 例子 未用opacity之前: 使用opacity之後:div背景顏色也透明 div裡邊的文字也
sqler sql 轉rest api 原始碼解析(一)應用的啟動入口
sqler sql 轉rest api 的原始碼還是比較簡單的,沒有比較複雜的設計,大部分都是基於開源 模組實現的。 說明: 當前的版本為2.0,程式碼使用go mod 進行包管理,如果本地執行注意golang 版本,我使用docker 執行, 參考 https://github.com/
Unity的IOS PlayerSettings的設定說明(一)
Unity專案輸出到IOS平臺釋出時,需要進行一些PlayerSettings的設定,對關鍵的一些設定做一些說明: IOS的PlayerSettings分為: ● Resolution and Presentation 即解析度及樣式 這一項主要是對旋
C語言常見錯誤雜談(一)scanf()、scanf_s()與錯誤 C4996與解決方法
錯誤 C4996 初學C語言時,第一個接觸到的I/O函式便是scanf()了。但在高版本的 Visual Studio (包括但不限於2015、2013、2012)編譯程式碼時,卻會出現意想不到的錯誤。 有如下一段簡單的程式碼: #include "stdio.h" int main(void) {

