
spring-boot使用itext與jfree匯出pdf報表
阿新 • • 發佈:2019-01-30
報表在專案開發中經常使用,itext是生成報表的java元件,對比於之前使用的poi,itext側重於pdf格式報表,並結合jfreechar製作圖表,能夠為使用者多樣化顯示資料。本文結合專案應用案例使用進行描述。
首先用一張圖來顯示生成的報表樣式:
1. pom檔案匯入itext引用
  <!-- https://mvnrepository.com/artifact/org.jfree/jfreechart -->
        <dependency>
            <groupId>org.jfree</groupId>
            <artifactId>jfreechart</artifactId>
            <version>1.0.19</version>
        </dependency>

        <!--<dependency>
            <groupId>org.springframework.boot</groupId>
            <artifactId>spring-boot-starter-test</artifactId>
        </dependency>
        -->
        <!-- itext方式匯出pdf -->
        <dependency>
            <groupId>com.itextpdf</groupId>
            <artifactId>itextpdf</artifactId>
            <version>5.5.4</version>

            <!-- <version>5.5.6</version>-->


            <!-- After release 2.1.7, iText moved from the MPLicense to the AGPLicense.
                The groupId changed from com.lowagie to com.itextpdf and the artifactId from itext to itextpdf.
                See http://itextpdf.com/functionalitycomparison for more information
               <groupId>com.lowagie</groupId>
              <artifactId>itext</artifactId>
              <version>4.2.2</version>
             <version>4.2.2</version>-->

        </dependency>
        <dependency>
            <groupId>com.lowagie</groupId>
            <artifactId>itext</artifactId>
            <version>2.1.7</version>
            <!-- <version>4.2.2</version>-->

        </dependency>
        <!-- https://mvnrepository.com/artifact/com.lowagie/itext-rtf -->
        <dependency>
            <groupId>com.lowagie</groupId>
            <artifactId>itext-rtf</artifactId>
            <version>2.1.7</version>
        </dependency>
        <dependency>
            <groupId>org.apache.poi</groupId>
            <artifactId>poi</artifactId>
           <!-- <version>3.16</version>-->
            <version>3.7</version>


        </dependency>
        <!-- https://mvnrepository.com/artifact/com.itextpdf/itext-asian -->
        <dependency>
            <groupId>com.itextpdf</groupId>
            <artifactId>itext-asian</artifactId>
            <version>5.2.0</version>
        </dependency>
2. 文字樣式匯入方法
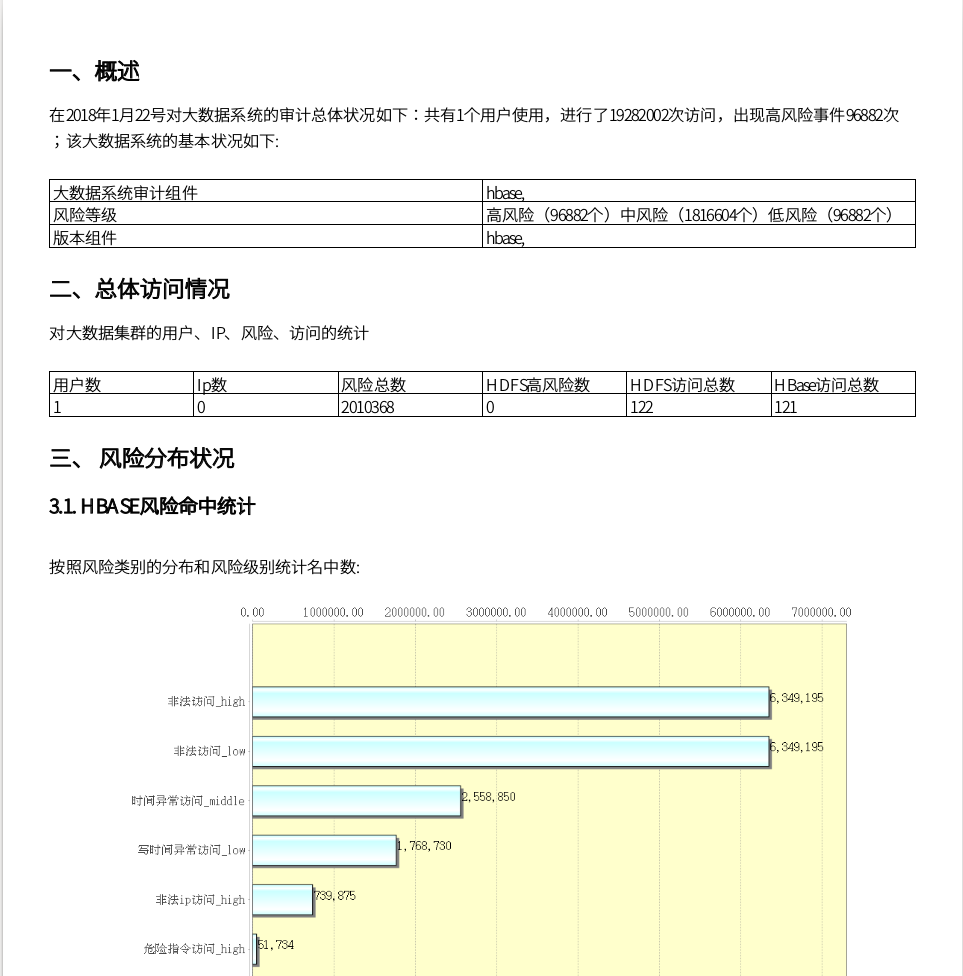
BaseFont bfChinese = BaseFont.createFont("STSong-Light", "UniGB-UCS2-H", BaseFont.NOT_EMBEDDED);//設定中文字型
Font font = new Font(bfChinese, 10);
Font headFont = new Font(bfChinese, 14, Font.BOLD);//設定字型
Font littleHeadFont = new Font(bfChinese, 12, Font.BOLD);
Document document = new com.itextpdf.text.Document(PageSize.A4,
        MARGIN_OF_ONE_CM, MARGIN_OF_ONE_CM, MARGIN_OF_ONE_CM, MARGIN_OF_ONE_CM);  //設定A4紙張樣式,每頁填充滿後自動換行
PdfWriter writer = PdfWriter.getInstance(document, response.getOutputStream());
//設定文字屬性
document.addAuthor("gskj");
document.addSubject("Subject");
document.addLanguage("chinese");
document.addCreationDate();
document.addCreator("whp");
document.addTitle("title");
writer.setTagged();
writer.createXmpMetadata();
document.open();
//定義段落
Paragraph paragraph = new Paragraph();
//設定段落前後間距
paragraph.setSpacingAfter(10);
paragraph.setSpacingBefore(10);
paragraph.setFont(font);
ReportVo overView = exportVo.getOverView();
Paragraph bigTitle = new Paragraph("一、概述", headFont);
StringBuffer overViewBuffer = new StringBuffer("在2018年1月22號對大資料系統的審計總體狀況如下:共有");
overViewBuffer.append(overView.getUserNumber());
overViewBuffer.append("個使用者使用,進行了");
overViewBuffer.append(overView.getVisitsTotal());
overViewBuffer.append("次訪問,出現高風險事件");
overViewBuffer.append(overView.getHighEventNumber());
overViewBuffer.append("次;該大資料系統的基本狀況如下:");
paragraph.add(overViewBuffer.toString());
document.add(bigTitle);
document.add(paragraph); //document檔案流中新增資料
3. 使用jFreeChart匯出圖表,前期經過一番實驗,利用itext介面直接匯入jfreechart圖表只提供了絕對定位的介面(也許是沒有找到相對定位),當表格資料或者圖表資料無法確定大小的情況下,樣式不好控制,因此採用一種巧妙的方式,將jfreeChart轉化為圖片,並將圖片作為document元素匯入,樣式更加美觀可控。
/**
 * 柱狀圖
 *
 * @param dataset         資料集
 * @param xName           x軸的說明(如種類,時間等)
 * @param yName           y軸的說明(如速度,時間等)
 * @param chartTitle      圖示題
 * @param charName        生成圖片的名字
 * @param plotOrientation 方向
 * @return
 */
public JFreeChart createBarChart(CategoryDataset dataset, String xName,
                                 String yName, String chartTitle, String charName, PlotOrientation plotOrientation) {
    JFreeChart chart = ChartFactory.createBarChart(chartTitle, // 圖表標題
            xName, // 目錄軸的顯示標籤
            yName, // 數值軸的顯示標籤
            dataset, // 資料集
            plotOrientation, // 圖表方向:水平、垂直
            true, // 是否顯示圖例(對於簡單的柱狀圖必須是false)
            false, // 是否生成工具
            false // 是否生成URL連結
    );
    java.awt.Font labelFont = new java.awt.Font("STSong-Light", java.awt.Font.PLAIN, 16);
    /*
     * VALUE_TEXT_ANTIALIAS_OFF表示將文字的抗鋸齒關閉,
     * 使用的關閉抗鋸齒後,字型儘量選擇12到14號的宋體字,這樣文字最清晰好看
     */
    // chart.getRenderingHints().put(RenderingHints.KEY_TEXT_ANTIALIASING,RenderingHints.VALUE_TEXT_ANTIALIAS_OFF);
    chart.setTextAntiAlias(false);
    chart.setBackgroundPaint(Color.white);
    // create plot
    CategoryPlot plot = chart.getCategoryPlot();
    // 設定橫虛線可見
    plot.setRangeGridlinesVisible(true);
    // 虛線色彩
    plot.setRangeGridlinePaint(Color.gray);
    // 資料軸精度
    NumberAxis vn = (NumberAxis) plot.getRangeAxis();
    // vn.setAutoRangeIncludesZero(true);
    DecimalFormat df = new DecimalFormat("#0.00");
    vn.setNumberFormatOverride(df); // 資料軸資料標籤的顯示格式
    // x軸設定
    CategoryAxis domainAxis = plot.getDomainAxis();
    domainAxis.setLabelFont(labelFont);// 軸標題
    domainAxis.setTickLabelFont(labelFont);// 軸數值
    domainAxis.setMaximumCategoryLabelWidthRatio(0.6f);// 橫軸上的 Lable 是否完整顯示
    // 設定距離圖片左端距離
    domainAxis.setLowerMargin(0.1);
    // 設定距離圖片右端距離
    domainAxis.setUpperMargin(0.1);
    // 設定 columnKey 是否間隔顯示
    // domainAxis.setSkipCategoryLabelsToFit(true);
    plot.setDomainAxis(domainAxis);
    // 設定柱圖背景色(注意,系統取色的時候要使用16位的模式來檢視顏色編碼,這樣比較準確)
    plot.setBackgroundPaint(new Color(255, 255, 204));
    // y軸設定
    ValueAxis rangeAxis = plot.getRangeAxis();
    rangeAxis.setLabelFont(labelFont);
    rangeAxis.setTickLabelFont(labelFont);
    // 設定最高的一個 Item 與圖片頂端的距離
    rangeAxis.setUpperMargin(0.15);
    // 設定最低的一個 Item 與圖片底端的距離
    rangeAxis.setLowerMargin(0.15);
    plot.setRangeAxis(rangeAxis);
    BarRenderer renderer = new BarRenderer();
    // 設定柱子寬度
    renderer.setMaximumBarWidth(0.05);
    // 設定柱子高度
    renderer.setMinimumBarLength(0.2);
    // 設定柱子邊框顏色
    renderer.setBaseOutlinePaint(Color.BLACK);
    // 設定柱子邊框可見
    renderer.setDrawBarOutline(true);
    // // 設定柱的顏色
    renderer.setSeriesPaint(0, new Color(204, 255, 255));
    renderer.setSeriesPaint(1, new Color(153, 204, 255));
    renderer.setSeriesPaint(2, new Color(51, 204, 204));
    // 設定每個地區所包含的平行柱的之間距離
    renderer.setItemMargin(0.0);
    // 顯示每個柱的數值,並修改該數值的字型屬性
    renderer.setIncludeBaseInRange(true);
    renderer.setBaseItemLabelGenerator(new StandardCategoryItemLabelGenerator());
    renderer.setBaseItemLabelsVisible(true);
    renderer.setBaseItemLabelFont(labelFont);
    if(plotOrientation.equals(PlotOrientation.HORIZONTAL)){ //控制結果資料在柱狀圖的位置
        renderer.setBasePositiveItemLabelPosition(new ItemLabelPosition(ItemLabelAnchor.OUTSIDE3, TextAnchor.BASELINE_LEFT));
    }
    plot.setRenderer(renderer);
    // 設定柱的透明度
    plot.setForegroundAlpha(1.0f);
    FileOutputStream fos_jpg = null;
    try {
        isChartPathExist(CHART_PATH);
        String chartName = CHART_PATH + charName;
        fos_jpg = new FileOutputStream(chartName);
        ChartUtilities.writeChartAsPNG(fos_jpg, chart, 500, 500, true, 10);
        return chart;
    } catch (Exception e) {
        e.printStackTrace();
        return null;
    } finally {
        try {
            fos_jpg.close();
        } catch (Exception e) {
            e.printStackTrace();
        }
    }
}
/**
 * 判斷資料夾是否存在,如果不存在則新建
 *
 * @param chartPath
 */
private void isChartPathExist(String chartPath) {
    File file = new File(chartPath);
    if (!file.exists()) {
        file.mkdirs();
        // log.info("CHART_PATH="+CHART_PATH+"create.");
    }
}
示例程式碼:
double[][] data = new double[][]{
     {672, 766, 223, 540, 126}
};
String[] rowKeys = {"蘋果"};
String[] columnKeys = {"北京", "上海", "廣州", "成都", "深圳"};
CategoryDataset datasetBar = pm.getBarData(data, rowKeys, columnKeys);
JFreeChart chart =pm.createBarChart(datasetBar, "x座標", "y座標", "柱狀圖", "bar.png");
File fileName = new File("/root/jfreechart2.pdf");
JFreeChart chart = createBarChart(datasetBar, "", "", "", ".png", PlotOrientation.HORIZONTAL);
Image logoImage = Image.getInstance(ChartUtilities.encodeAsPNG(chart.createBufferedImage(1080, 920))); //轉化為圖片
logoImage.scaleAbsolute(500, 400); //設定圖片大小
logoImage.setAccessibleAttribute(PdfName.ALT, new PdfString("Logo"));
document.add(logoImage);
4. 製做表格
private PdfPTable createTable(int numCloumns, int numRows, String[][] data, Font font) {
        PdfPTable table = new PdfPTable(numCloumns);
        table.setWidthPercentage(100); // 寬度100%填充
        table.setSpacingBefore(10f); // 前間距
        table.setSpacingAfter(10f); // 後間距
        ArrayList<PdfPRow> listRow = table.getRows();

        for (int i = 0; i < numRows; i++) {
            //行1
            PdfPCell cells[] = new PdfPCell[numCloumns];
            PdfPRow row = new PdfPRow(cells);
            for (int j = 0; j < numCloumns; j++) {
                cells[j] = new PdfPCell(new Paragraph(data[i][j], font));
            }
            listRow.add(row);
        }

        return table;
    }
舉例:
array5[0][0] = "語句型別";
array5[0][1] = "語句數";
for (int i = 1; i < statementActionList.size() + 1; i++) {
     array5[i][0] = statementActionList.get(i - 1).getStatementType();  //第一列資料
     array5[i][1] = statementActionList.get(i - 1).getStatementNumber(); //第二列資料
}
PdfPTable table5 = createTable(2, statementActionList.size() + 1, array5, font);
document.add(table5);