手把手教你DIY一個春運遷徙圖(一)
換了新工作,也確定了我未來資料視覺化的發展方向。新年第一篇部落格,又逢春運,這篇技術文章就來交給大家如何做一個酷炫的遷徙圖(支援移動哦)。(求star 程式碼點這裡)
遷徙圖的製作思路分為靜態的元素和變換的動畫。其中動畫是圍繞著靜態的元素變換,所以我們首要的任務就是如何繪製靜態的元素。
仔細看一下,靜態的元素分為弧線(Arc)、弧線端點的箭頭(Marker),動畫部分主要是弧線終點向脈衝波一樣的圓(Pulse),以及像流星一樣的動態小箭頭和弧線的光暈,這兩個我們放在一起成為Spark。我們可以看到Spark主要在弧線上運動,如果你仔細觀察一下會發現終點處點頭的指向也是朝著終點處的切線方向,所以我們把主要的任務放在如何根據兩個點繪製一段弧線。
我們要繪製這段弧線就要知道圓心和半徑,而數學定理告訴我們的是三點定圓,過兩個點的圓有無數個,所以我們只能找一個比較合適的圓。
所以現在的問題變成了已知兩點pointF和pointT,求一個合適的圓心pointC (xc, yc);
根據pointF和pointT所以我們能夠確定一條直線,他的斜率 kt =(yt - yf)/ (xt - xf);
根據PointF和pointT我們能夠計算出他們的中點pointH=(m, n); m = (xt - xf) / 2, n = (yt - yf) / 2;
經過兩點的圓一定在他們兩點的中垂線上,而直線的中垂線斜率kl與直線的斜率kt存在數學關係:kl * kt = -1;
把我們的引數全部套入這個公式可得:
((yc - n)/ (xc - m)) * ((yt - yf)/ (xt - xf)) = -1;
接著變換一下:
(yc - n) / (xc - m) = -(xt - xf) / (yt - yf);
去掉礙事的負號:
(yc - n) / (xc - m) = (xt - xf) / (yf - yt);
再變換一下:
(yc - n)/ (xt - xf) = (xc - m) / (yf - yt) = factor;
到此我們得到:
yc - n = (xt - xf) * factor;
xc - m = (yf - yt) * factor;
這兩行公式中都各存在兩個位置引數(yc、factor) 和 (xc、factor);所以只要找到一個合適的factor就能夠得到合適的圓心進而得到半徑起始角和終止角以及半徑。有了這些那麼Marker的指向、Spark的軌跡都可以確定了。
現在需要做的是把上述過程轉換為程式碼:
var Arc = (function() {
    var A = function(options) {
      var startX = options.startX,
      startY = options.startY,
      endX = options.endX,
      endY = options.endY;

      //兩點之間的圓有多個,通過兩點及半徑便可以定出兩個圓,根據需要選取其中一個圓
      var L = Math.sqrt(Math.pow(startX - endX, 2) + Math.pow(startY - endY, 2));
      var m = (startX + endX) / 2; // 橫軸中點
      var n = (startY + endY) / 2; // 縱軸中點
      var factor = 1.5;

      var centerX = (startY - endY) * factor + m;
      var centerY = (endX - startX) * factor + n;

      var radius = Math.sqrt(Math.pow(L / 2, 2) + Math.pow(L * factor, 2));
      var startAngle = Math.atan2(startY - centerY, startX - centerX);
      var endAngle = Math.atan2(endY - centerY, endX - centerX);

      // this.L = L;
      this.startX = startX;
      this.startY = startY;
      this.endX = endX;
      this.endY = endY;
      this.centerX = centerX;
      this.centerY = centerY;
      this.startAngle = startAngle;
      this.endAngle = endAngle;
      this.startLabel = options && options.labels && options.labels[0],
      this.endLabel = options && options.labels && options.labels[1],
      this.radius = radius;
      this.lineWidth = options.width || 1;
      this.strokeStyle = options.color || '#000';
      this.shadowBlur = options.shadowBlur;
    };

    A.prototype.draw = function(context) {
      context.save();
      context.lineWidth = this.lineWidth;
      context.strokeStyle = this.strokeStyle;
      context.shadowColor = this.strokeStyle;
      context.shadowBlur = this.shadowBlur || 2;

      context.beginPath();
      context.arc(this.centerX, this.centerY, this.radius, this.startAngle, this.endAngle, false);
      context.stroke();
      context.restore();

      context.save();
      context.fillStyle = this.strokeStyle;
      context.font = "15px sans-serif";
      if (this.startLabel) {
        context.fillText(this.startLabel, x, y);
      }
      if (this.endLabel) {
        context.fillText(this.endLabel, x, y);
      }
      context.restore();
    };

    return A;
  })();
理解了上述過程,我們就已經成功了一半。下一步的重點就是動畫的繪製。關於動畫首先要了解requestAnimationFrame,不知道的小夥伴要去惡補一下啦。好啦,言歸正傳。Spark動畫分為兩部分,一部拖尾效果,一部分是弧線光暈效果,當你第一次開啟時候會發現,弧線光暈會隨著小箭頭運動,到達終點後光暈停止運動,剩下小箭頭自己運動。由於每個圓的大小不一致,我們需要在每次動畫過程中控制光暈和小箭頭的位置。
由於他們是在圓弧上運動,所以我們只要每次計算出他們新的弧度就可以了,弧度的步長可以這樣來制定:每走過20畫素所轉過的弧度就是各個Spark的步長啦。
所以factor = 20 / radius;
每次繪製時,光暈與小箭頭的弧度位置為:
var endAngle = this.endAngle;
      // 勻速
      var angle = this.trailAngle +  this.factor;
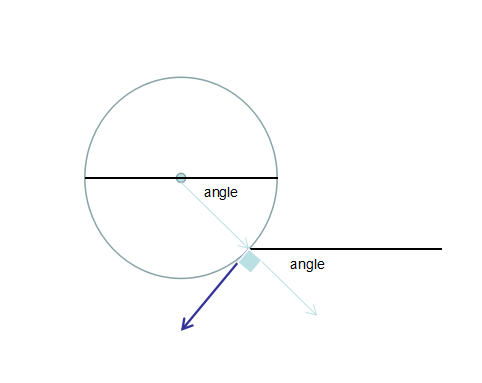
弧度確定之後我們就能得到小箭頭的位置,但是目前並不能得到小箭頭的方向。根據canvas中角度的特點,再由簡單的幾何知識,可以得到小箭頭的旋轉方向應該為:rotation = angle + Math.PI / 2;

目前為止我們解決了Spark動畫中的兩大問題,剩下了最後一個:拖尾效果。看起來由粗到細這段就是拖尾效果。

實際上為了保證在移動端的效能,本次例項中並沒有明顯的拖尾。但拖尾還是一個比較常見的特效,所以我們需要把它掌握。拖尾效果一般是對一個元素進行多次複製,併線性的漸變這隊影元素的大小寬度以及顏色的透明度在達到由粗到細由大到小顏色有深變淺的效果。那麼每次繪製時候都需要知道這隊影元素每個的位置,每個的線寬以及每個的顏色,根據上面討論的元素位置需要根據弧度來確定。我們說過他們的位置是漸變的,漸變的步長可以這樣指定,假設從頭到尾的弧長為80,那麼每個影元素的之間的間隔為:
this.deltaAngle = (80 / Math.min(this.radius, 400)) / this.tailPointsCount;
由此便可繪製出拖尾效果:
// 拖尾效果
      var count = this.tailPointsCount;
      for (var i = 0;  i < count; i++) {
        var arcColor = utils.calculateColor(this.strokeStyle, 0.3-0.3/count*i);
        var tailLineWidth = 5;
        if (this.trailAngle - this.deltaAngle * i > this.startAngle)  {
          this.drawArc(context, arcColor,
            tailLineWidth - tailLineWidth / count * i,
            this.trailAngle - this.deltaAngle * i,
            this.trailAngle
          );
        }
      }
所以整個Spark的程式碼如下:


var Spark = (function() {
    var S = function(options) {
      var startX = options.startX,
      startY = options.startY,
      endX = options.endX,
      endY = options.endY;

      //兩點之間的圓有多個,通過兩點及半徑便可以定出兩個圓,根據需要選取其中一個圓
      var L = Math.sqrt(Math.pow(startX - endX, 2) + Math.pow(startY - endY, 2));
      var m = (startX + endX) / 2; // 橫軸中點
      var n = (startY + endY) / 2; // 縱軸中點
      var factor = 1.5;

      var centerX = (startY - endY) * factor + m;
      var centerY = (endX - startX) * factor + n;

      var radius = Math.sqrt(Math.pow(L / 2, 2) + Math.pow(L * factor, 2));
      var startAngle = Math.atan2(startY - centerY, startX - centerX);
      var endAngle = Math.atan2(endY - centerY, endX - centerX);

      // 保證Spark的弧度不超過Math.PI
      if (startAngle * endAngle < 0) {
        if (startAngle < 0) {
          startAngle += Math.PI * 2;
          endAngle += Math.PI * 2;
        } else {
          endAngle += Math.PI * 2;
        }
      }

      this.tailPointsCount = 5; // 拖尾點數
      this.centerX = centerX;
      this.centerY = centerY;
      this.startAngle = startAngle;
      this.endAngle = endAngle;
      this.radius = radius;
      this.lineWidth = options.width || 5;
      this.strokeStyle = options.color || '#000';
      this.factor = 2 / this.radius;
      this.deltaAngle = (80 / Math.min(this.radius, 400)) / this.tailPointsCount;
      this.trailAngle = this.startAngle;
      this.arcAngle = this.startAngle;

      this.animateBlur = true;

      this.marker = new Marker({
        x: 50,
        y:80,
        rotation: 50 * Math.PI / 180,
        style: 'arrow',
        color: 'rgb(255, 255, 255)',
        size: 2,
        borderWidth: 0,
        borderColor: this.strokeStyle
      });
    };

    S.prototype.drawArc = function(context, strokeColor, lineWidth, startAngle, endAngle) {
      context.save();
      context.lineWidth = lineWidth;
      // context.lineWidth = 5;
      context.strokeStyle = strokeColor;
      context.shadowColor = this.strokeStyle;
      // context.shadowBlur = 5;
      context.lineCap = "round";
      context.beginPath();
      context.arc(this.centerX, this.centerY, this.radius, startAngle, endAngle, false);
      context.stroke();
      context.restore();
    };

    S.prototype.draw = function(context) {
      var endAngle = this.endAngle;
      // 勻速
      var angle = this.trailAngle + (endAngle - this.startAngle) * this.factor;
      var strokeColor = this.strokeStyle;
      if (this.animateBlur) {
        this.arcAngle = angle;
      }
      this.trailAngle = angle;
      strokeColor = utils.calculateColor(strokeColor, 0.1);

      this.drawArc(context, strokeColor, this.lineWidth, this.startAngle, this.arcAngle);

      // 拖尾效果
      var count = this.tailPointsCount;
      for (var i = 0;  i < count; i++) {
        var arcColor = utils.calculateColor(this.strokeStyle, 0.3-0.3/count*i);
        var tailLineWidth = 5;
        if (this.trailAngle - this.deltaAngle * i > this.startAngle)  {
          this.drawArc(context, arcColor,
            tailLineWidth - tailLineWidth / count * i,
            this.trailAngle - this.deltaAngle * i,
            this.trailAngle
          );
        }
      }

      context.save();
      context.translate(this.centerX, this.centerY);
      this.marker.x = Math.cos(this.trailAngle) * this.radius;
      this.marker.y = Math.sin(this.trailAngle) * this.radius;
      this.marker.rotation = this.trailAngle + Math.PI / 2;
      this.marker.draw(context);
      context.restore();

      if ((endAngle - this.trailAngle) * 180 / Math.PI < 0.5) {
        this.trailAngle = this.startAngle;
        this.animateBlur = false;
      }
    };

    return S;
  })();
Spark原始碼
到目前為止,遷徙圖中主要的技術難點就已經講完了。但如何把它放到地圖上,這個問題我們將在下篇文章中討論。
