
logstash、elasticsearch、kibana搭建日誌平臺
1、下載logstash
b、解壓:tar -xzvf logstash-5.1.1.tar.gz
c、設定使用者測試的配置檔案:vim logstatsh_test.conf,編輯內容如下:
input {
    stdin {
    }
}
output {
    stdout {
    codec => rubydebug {}
    }
}- 1
- 2
- 3
- 4
- 5
- 6
- 7
- 8
- 9
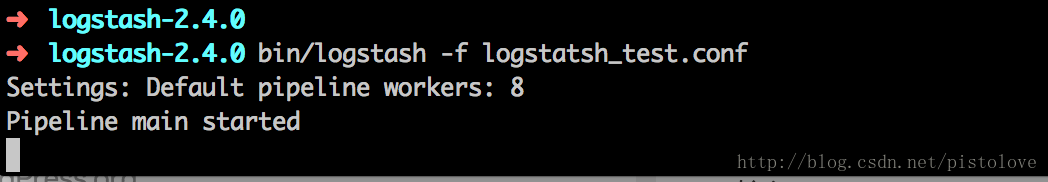
d、執行logstash測試:bin/logstash -f logstatsh_test.conf,執行成功介面如下:
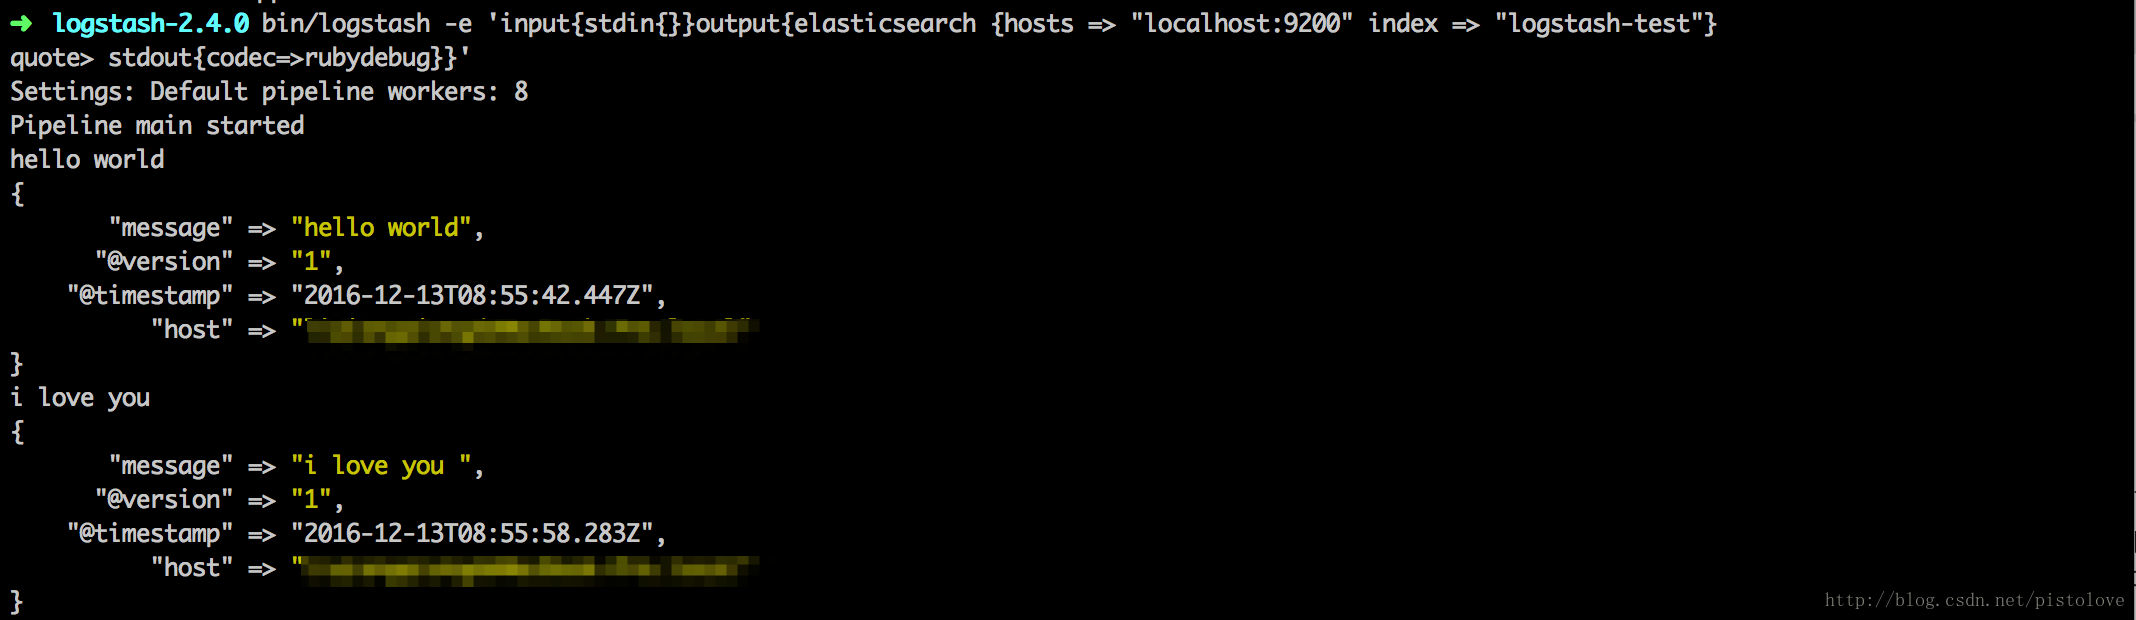
e、logstash和elasticsearch整合:可以直接命令列啟動如下
bin/logstash -e 'input{stdin{}}output{elasticsearch {hosts => "localhost:9200" index => "logstash_test"}
stdout{codec=>rubydebug}}'- 1
- 2
或者對logstatsh_test.conf進行修改如下
input{
    stdin{
    }
}
output{
    elasticsearch {
        hosts => "localhost:9200"
        index => "logstash_test"
    }
    stdout{
        codec=>rubydebug
    }
} - 1
- 2
- 3
- 4
- 5
- 6
- 7
- 8
- 9
- 10
- 11
- 12
- 13
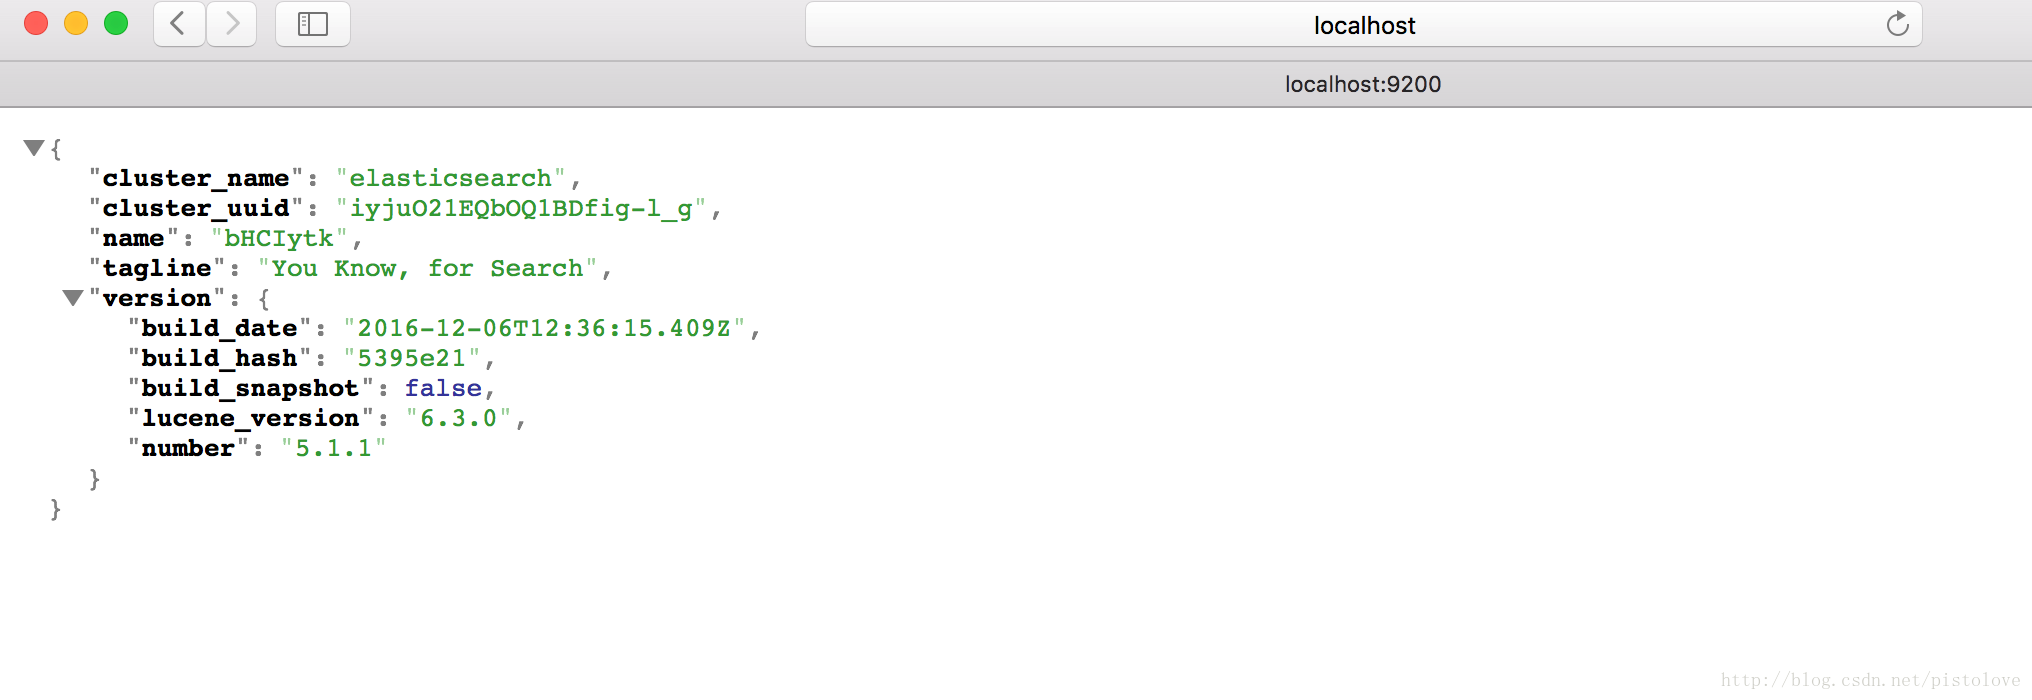
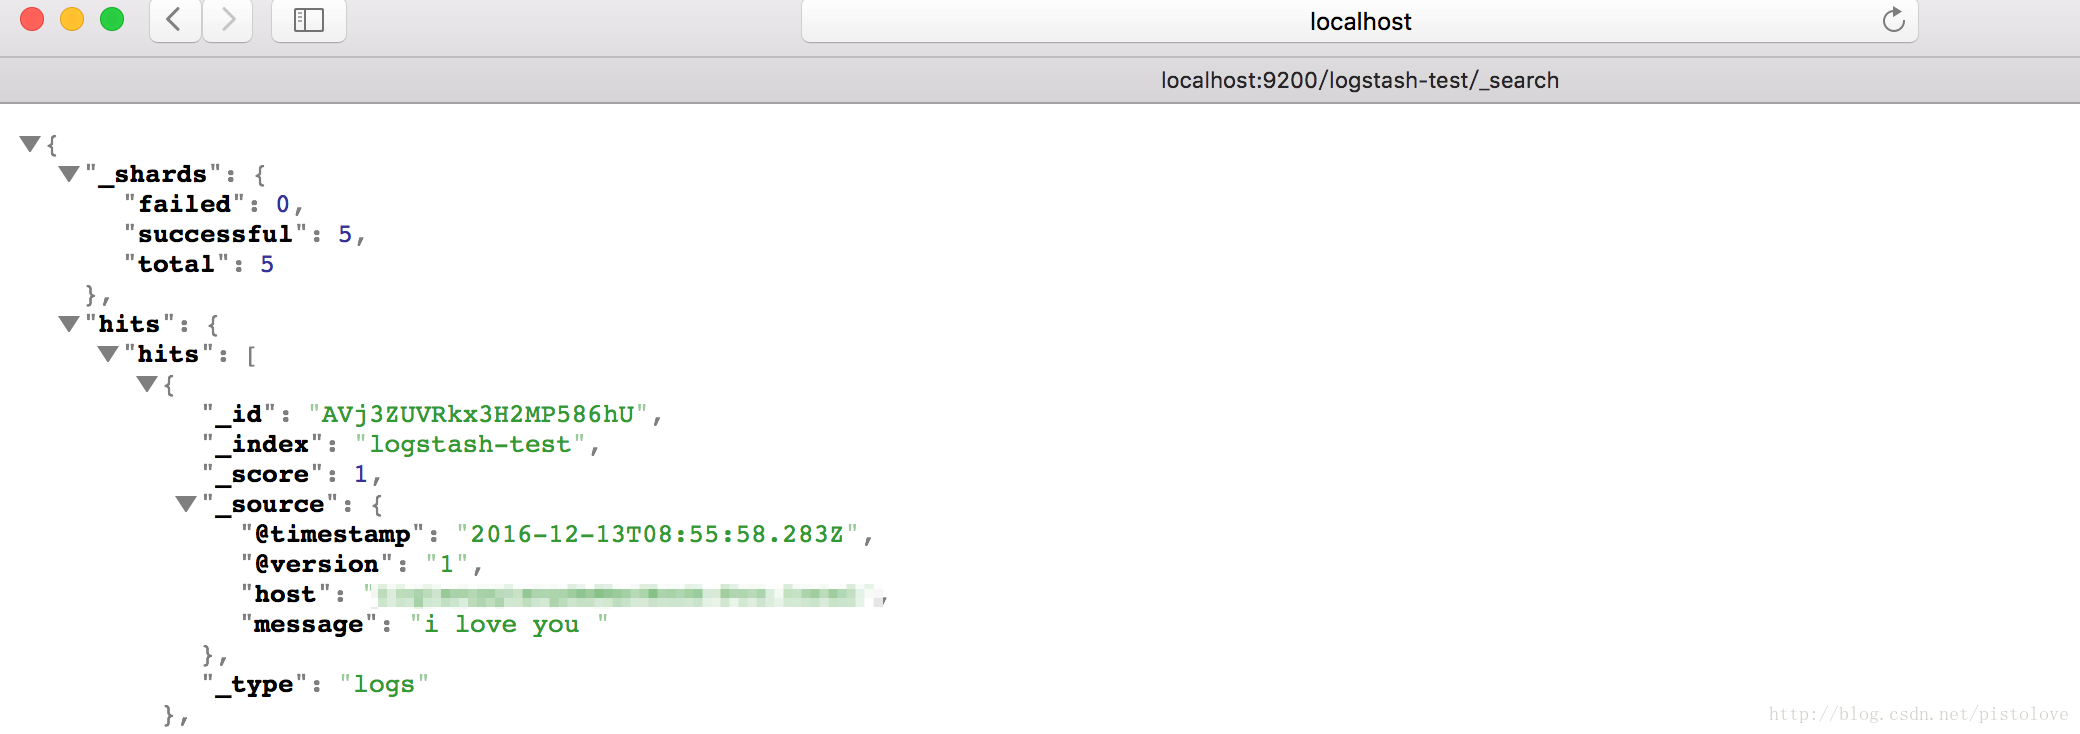
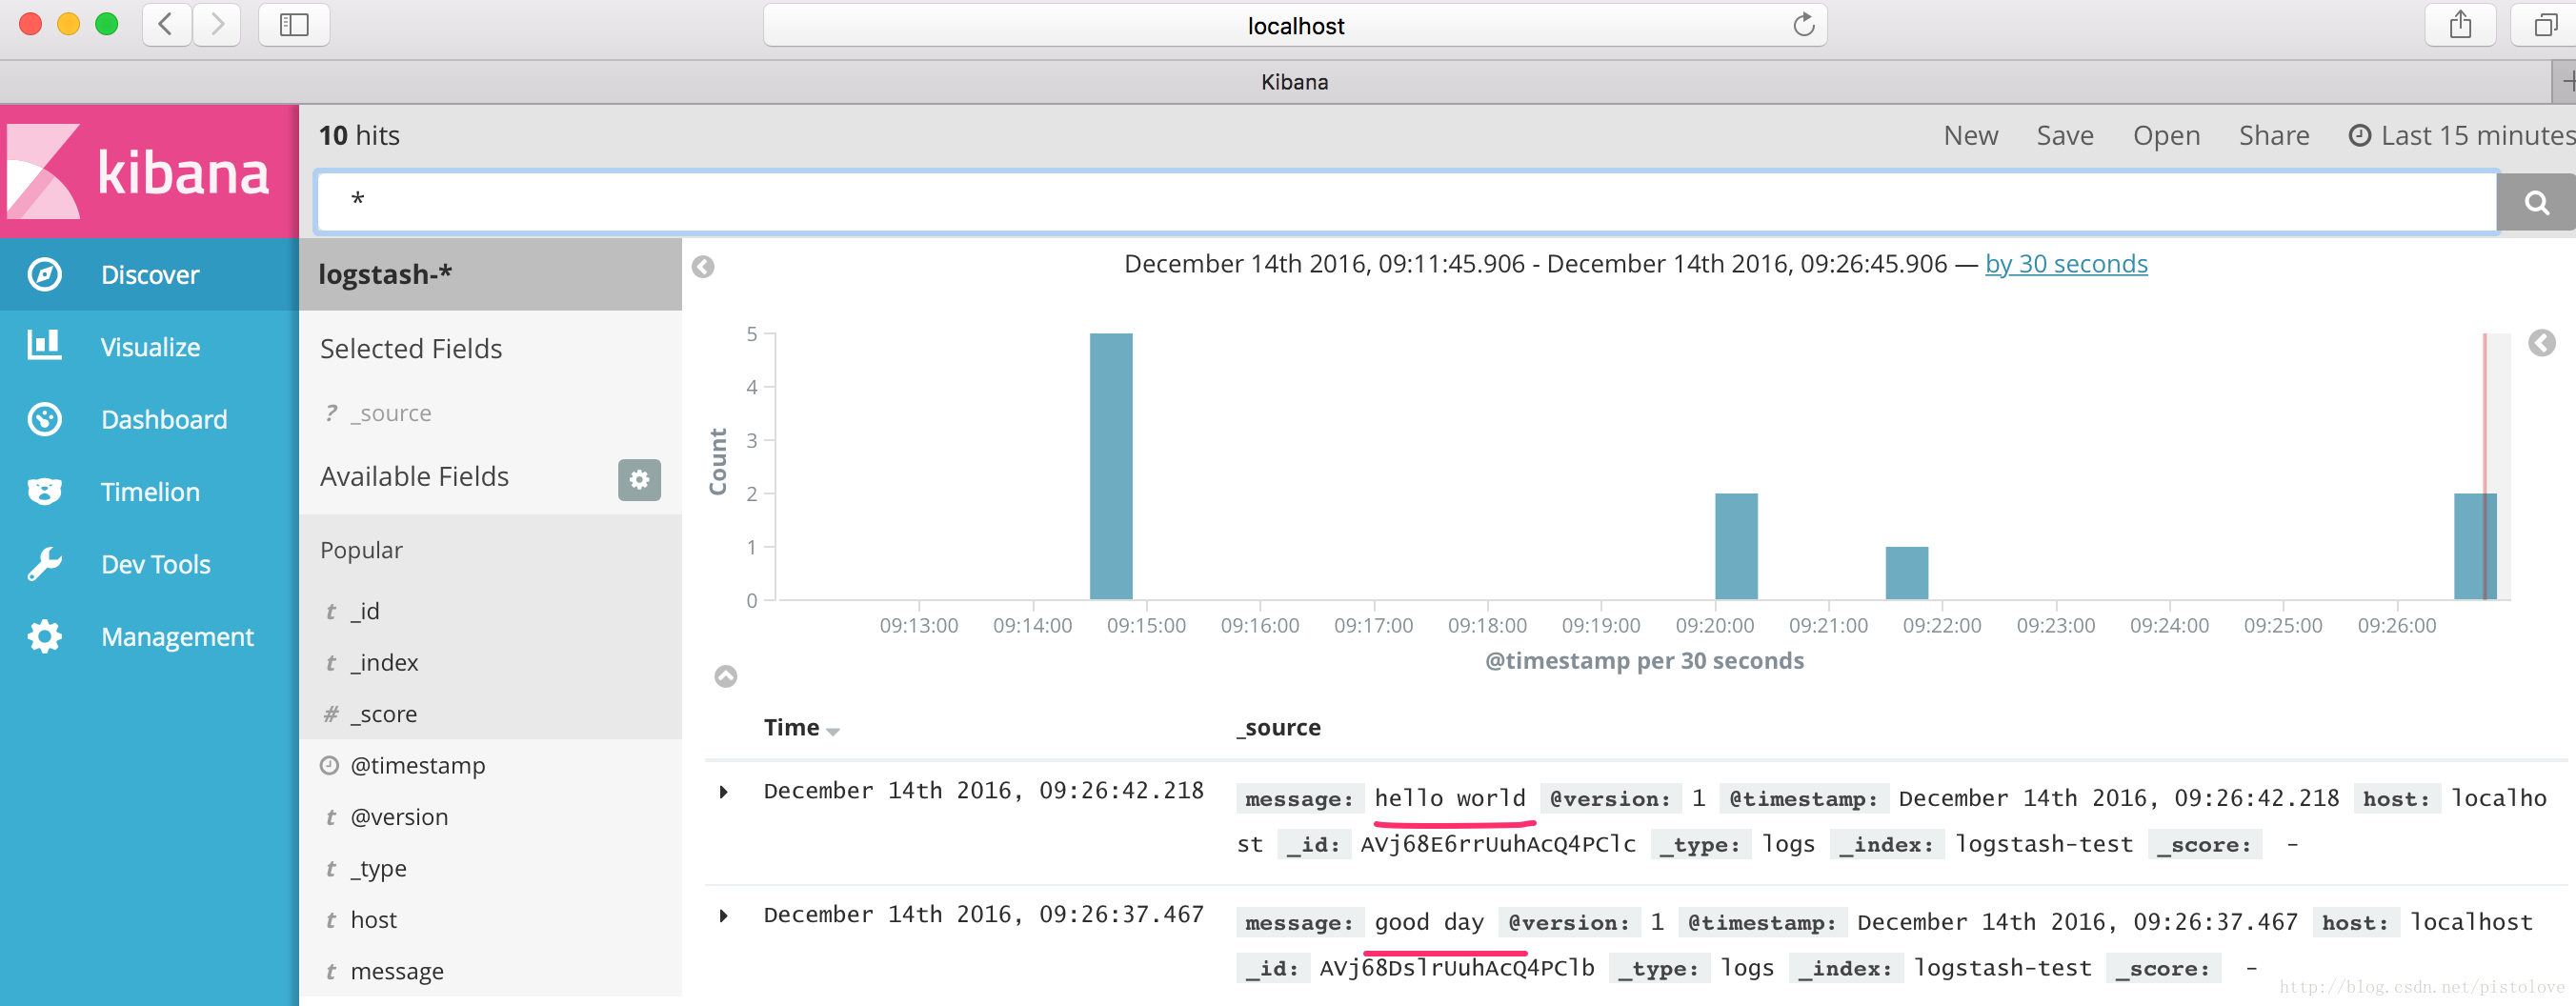
f、狀態檢視:
2、下載elasticsearch
b、解壓:tar -xzvf elasticsearch-5.1.1.tar.gz
c、配置檔案:vim config/elasticsearch.yml
path.data: /data/es #資料路徑
path.logs: /data/logs/es #日誌路徑
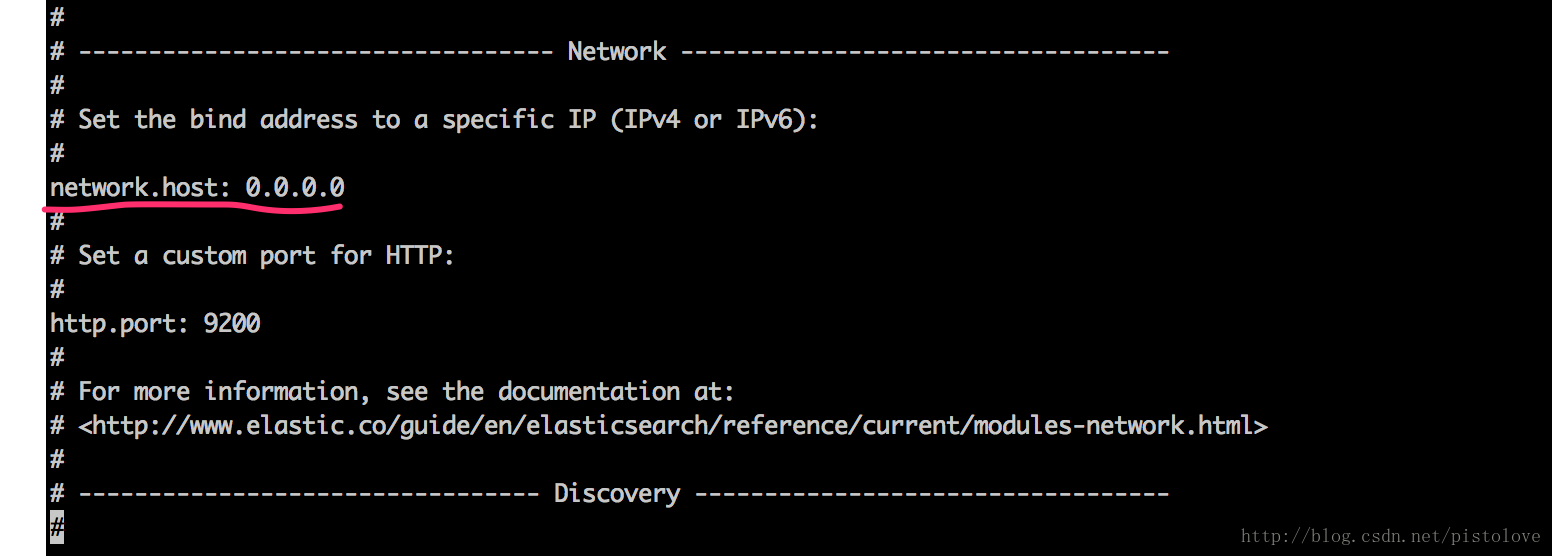
network.host: 本機地址 #伺服器地址
http.port: 9200 #埠- 1
- 2
- 3
- 4
d、啟動程式:/bin/elasticsearch
3、下載下載kibana
b、解壓:tar -xzvf kibana-5.1.1.tar.gz
c、設定配置檔案:開啟config/kibana.yml,修改如下內容
//啟動埠 因為埠受限 所以變更了預設埠
server.port: 8601
//啟動服務的ip
server.host: "本機ip"
//elasticsearch地址
elasticsearch.url: "http://localhost:9200”- 1
- 2
- 3
- 4
- 5
- 6
d、啟動程式:bin/kibana
4、注意:
a、elasticsearch和kibana版本要對應,否則服務起不來。
b、如果瀏覽器中訪問http://localhost:9200/沒有返回預期的結果,就需要修改Elasticsearch的配置,使其支援外網訪問。首先,按Ctrl +C停止Elasticsearch,然後,開啟Elasticsearch的配置檔案vimconfig/elasticsearch.yml,找到network.host這一行。
c、max virtual memory areas vm.max_map_count [65530] likely too low, increase to at least [262144]
解決:切換到root使用者修改配置sysctl.conf
vi /etc/sysctl.conf
新增下面配置:
vm.max_map_count=655360
並執行命令:
sysctl -p
d、max number of threads [1024] for user [lish] likely too low, increase to at least [2048]
解決:切換到root使用者,進入limits.d目錄下修改配置檔案。
vi /etc/security/limits.d/90-nproc.conf
修改如下內容:
soft nproc 1024
修改為
soft proc 2048
e、 ERROR: bootstrap checks failed max file descriptors [4096] for elasticsearch process likely too low, increase to at least [65536] max number of threads [1024] for user [lishang] likely too low, increase to at least [2048]
解決:切換到root使用者,編輯limits.conf 新增類似如下內容
vi /etc/security/limits.conf
新增如下內容:
soft nofile 65536
hard nofile 131072
soft nproc 2048
hard proc 4096
f、useradd: cannot open /etc/group;useradd: cannot open /etc/gshadow;useradd: cannot open /etc/passwd;useradd: cannot open /etc/shadow
1、lsattr /etc/group
—-i——–e- /etc/group
2、chattr -i /etc/group 依次去掉group、gshadow、passwd、shadow
3、建立elsearch使用者組及elsearch使用者
groupadd elasticsearch
4、更改elasticsearch資料夾及內部檔案的所屬使用者及組為elasticsearch: elasticsearch
useradd elasticsearch -g elsearch -p elasticsearch
cd /elasticsearch-5.1.1
chown -R elasticsearch: elasticsearch elasticsearch-5.1.1
5、切換到elasticsearch使用者再啟動
su elasticsearch
cd elasticsearch
./bin/elasticsearch
g、logstash啟動報錯
[2016-12-28T17:49:08,367][WARN ][logstash.outputs.elasticsearch] Attempted to resurrect connection to dead ES instance, but got an error. {:url=>#<URI::HTTP:0x1deb02b URL:http://10.129.28.149:9200>, :error_type=>LogStash::Outputs::ElasticSearch::HttpClient::Pool::BadResponseCodeError, :error=>"Got response code '401' contact Elasticsearch at URL 'http://10.129.28.149:9200/'"}- 1
如果重新設定了密碼,但是沒有配置密碼,就需要像下面一樣配置一下。
配置logstash.conf
output {
  elasticsearch {
    ...
    user => logstash_internal
    password => changeme
  }