
html5 canvas 實現進度條展示統計資料
阿新 • • 發佈:2019-02-02
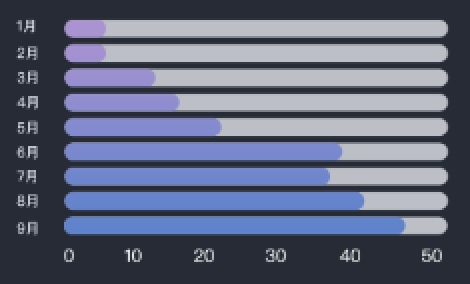
最終實現效果圖:
html程式碼:
<!DOCTYPE Html>
<html>
<head>
<title>Line Chart Demo</title>
<meta http-equiv="Content-Type" content="text/html;charset=UTF-8"/>
</head>
<body>
<header>預約掛號人數(<span id="hosUnitDiv"></span>)</header> script 程式碼:
/*進度條圖*/
/*
  @param1: 所畫圖的id
  @param2: 資料
  @param3: 整個所畫影象距離canvas左邊間距
  @param4: 影象距離右邊有一定的間距
  @param5: y軸每條橫線及刻度之間間距
  x軸之間的間距,是通過整個寬度算出來的
  retuan: 根據最大資料,返回單位
*/
var progressChart = {
  // 繪製chart
  drawChart: function(canvas2, data, padding, marginRight, ygap, bgLineColor, scaleColor) {
    this.canID2 = document.getElementById("canvas2");
    this.content2 = this.canID2.getContext("2d");
    // this.canID2.width = 500;
    var canRealWidth = this.canID2.width - marginRight; // 影象真實的寬度 (距離右邊canvas有一定的距離
    var dataMax = this.getArrayMax(data);  // 資料中最大的值
    var unit = this.getUnitByDataMax(dataMax); // 單位
    var xlimt = this.getXLimtByNewData(dataMax / (unit.number)); // x軸刻度 array
    var xgap = (canRealWidth - padding) / (xlimt.length - 1); // x軸刻度間距
    var newData = this.getNewDataByUnit(data, unit.number);
    var ymove = 5; // 整圖y軸,向下移動 解決0的時候,顯示不全問題
    this.canID2.height = ygap * (data.length) + ymove * 4;
    // 繪製x軸刻度
    for(var i=0; i<xlimt.length; i++) {
      // console.log(i*xgap + padding);
      this.content2.fillStyle = scaleColor;
      // this.content2.textAlign = "left";
      // if語句解決最後一個刻度,靠影象右端對齊問題
      if(i === xlimt.length -1) {
        this.content2.fillText(xlimt[i],i*xgap + padding - 16, ygap*data.length + ygap);
      } else {
        this.content2.fillText(xlimt[i],i*xgap + padding, ygap*data.length + ygap);
      }
    }
    for(var i=0; i<data.length; i++) {
      // 畫橫線
      this.content2.lineWidth=8;
      this.content2.strokeStyle=bgLineColor;// 筆觸顏色
      this.content2.beginPath();
      this.content2.moveTo(padding, ygap*i + ymove);
      this.content2.lineTo(canRealWidth, ygap*i + ymove);
      this.content2.lineCap = 'round';
      this.content2.stroke();
      this.content2.closePath();
      // y軸刻度
      this.content2.fillStyle = scaleColor;
      this.content2.textAlign = "left";//y軸文字靠右寫
      // this.content2.textBaseline = "middle";//文字的中心線的調整
      this.content2.font = '12px PingFang HK';
      this.content2.fillText(data[i].y, 0, ygap*i + 10);

      // 畫真實資料線
      /* 畫有漸變色線 */
      this.content2.beginPath();
      var linear_gradient = this.content2.createLinearGradient(0,0, canRealWidth,50);
      linear_gradient.addColorStop(0, '#5c80cd');
      linear_gradient.addColorStop(1, '#ac92d3');
      this.content2.strokeStyle = linear_gradient;
      this.content2.lineJoin = 'round';
      this.content2.lineWidth = 8;
      this.content2.strokeRect(padding, ygap*i + ymove, newData[i].x * (canRealWidth - padding) / xlimt[xlimt.length - 1], 0);
      /* 畫純顏色的線 */
      // this.content2.lineWidth="8";
      // this.content2.strokeStyle="#f00";// 刻度顏色
      // this.content2.beginPath();
      // this.content2.moveTo(padding, ygap*i + ymove);
      //  canRealWidth - padding  x軸真正總體的寬度(此處不是影象真實的寬度,要減去其實位置padding的值才是
      //   此處真實資料x軸座標的計算: x軸真正的寬度 比 x刻度最大的值   等於   真實資料x軸座標 比 真實除以單位資料的值
      //                           最後還要加上padding, 因為起始位置是padding而不是0
      // this.content2.lineTo(newData[i].x * (canRealWidth - padding) / xlimt[xlimt.length - 1] + padding, ygap*i + ymove);
      // this.content2.lineCap = 'round';
      // this.content2.stroke();
    }
    return unit;
  },
  // 根據x軸最大的資料 判斷單位 params: 原始資料中最大的值
  getUnitByDataMax: function(maxData) {
    if(maxData > 1000 && maxData <= 10000) {
      return unit = {text: '百人', number: 100};
    } else if(maxData > 10000) {
      return unit = {text: '千人', number: 1000};
    }
  },
  // 獲取x軸刻度 params:原始資料通過單位處理後的資料 的最大值
  getXLimtByNewData: function(handleByUnitNewdataMax) {
    if (handleByUnitNewdataMax > 0 && handleByUnitNewdataMax <= 50) {
      return xlimt = [0, 10, 20, 30, 40, 50];
    } else {
      return xlimt = [0, 20, 40, 60 ,80, 100];
    }
  },
  // 根據單位處理原始資料,獲取到新的資料
  getNewDataByUnit: function(data, unit) {
    var canvas2NewData = [];
    // var canvas2NewData = canvas2Data.map(function(item) {
    //   item.x = item.x /unit;
    // }); ??? 為什麼map不可以
    for (var i = 0; i < canvas2Data.length; i++) {
      canvas2NewData[i] = {y: canvas2Data[i].y, x:canvas2Data[i].x / unit};
    };
    return canvas2NewData;
  },
  // 獲取x軸 最大值
  getArrayMax: function(array) {
    return array.reduce(function(prev, next) {
      if (prev.x > next.x) { return prev.x;} else {return next.x};
    });
  }
}