
netty 4.0.24版本Direct Memory Leak
現象

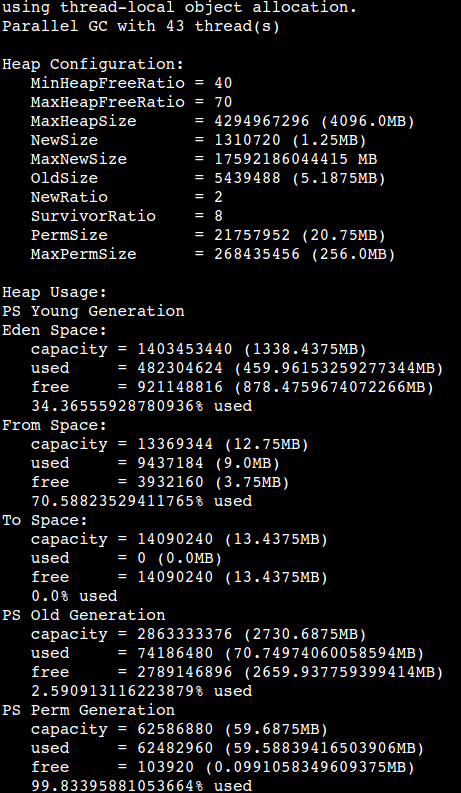
top顯示常駐記憶體已經達到14G,而JVM本身的記憶體佔用不高 -XMX 配置的是4096M.
分析
jmap -heap pid
jvm本身是沒有問題的,而且應用表現也沒有什麼異常,但機器的記憶體已經佔用很高,觸發了機器監控的
記憶體報警.因為這個應用使用了netty,因為初步分析應該是有Direct Memory 沒有回收處理。
採用pmap 檢視程序記憶體情況
pmap -x pid
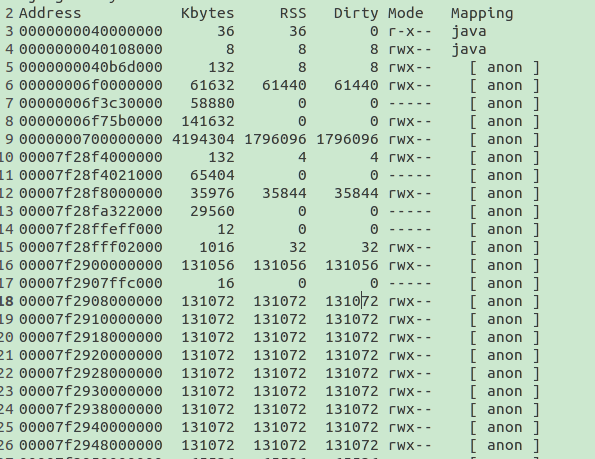
發現有大量的131072k 即128M。這樣的記憶體地址有77個,應該這就是為什麼記憶體一直高的原因了。
接著找到是誰怎麼建立的這些堆外記憶體,首先懷疑的重點物件就是netty了。netty 這個高效能的nio框架
會申請堆外記憶體。但不能去全盤看netty的原始碼,這不太可能,所以只能先看看這些記憶體裡面是存的是什
麼東西,看看能否有什麼線索。採用gdb這個工具來嘗試一把
gdb --pid pid
然後執行
dump binary memory result.bin 0x00007f2908000000 0x00007f2910000000
會有一個result.bin的檔案,然後通過hexdump 進行檢視發現如下資料
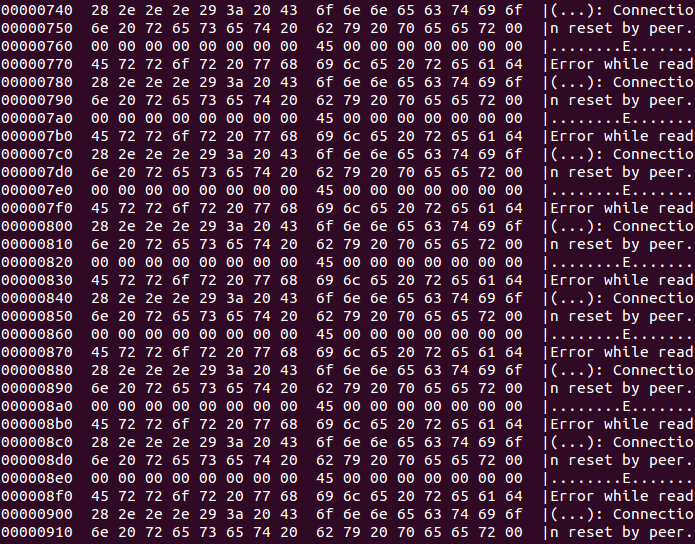
記憶體放的大量的
Error while read (...): Connection reset by peer.
這個就是解決問題的突破點了
定位
來怎麼來定位是netty哪塊程式碼執行會導致這樣的大量的堆外記憶體了,根據其存在的字串分析應該是
在讀取資料的時候傳送斷連線斷掉了。檢視netty原始碼,checkout 4.0 reset到4.0.24 final版本
全文search Error while read (…): Connection reset by peer。然後在io_netty_channel_epoll_Native.c中看到如下程式碼
jint read0(JNIEnv * env, jclass clazz, jint fd, void *buffer, jint pos, jint limit) {
ssize_t res;
int err;
do {
res = read 問題很可能就是在ThrowNew這個異常這裡了 google下,發現如下
fixing small leak on exception on the transport-epoll-native allocation
Motivation:
the JNI function ThrowNew won’t release any allocated memory.
The method exceptionMessage is allocating a new string concatenating 2 constant strings
What is creating a small leak in case of these exceptions are happening.
Modifications:
Added new methods that will use exceptionMessage and free resources accordingly.
I am also removing the inline definition on these methods as they could be reused by
other added modules (e.g. libaio which should be coming soon)
Result:
No more leaks in case of failures.
同時在netty 的issuse中也能找到對應的記錄但作者似乎說這是個優化改進
解決
出現這個問題的場景是在開啟epoll而且有特別多的這種connection reset的現象
解決就很簡單了升級netty版本
其他
在分析解決這個問題的過程中google發現一篇帖子,現象和我遇到的場景很像
地址 作者通過優化glibc的環境變數能優化一些堆外記憶體的佔用,但個人覺得這個應該不是解決問題的根本點
- Garbage collection. As you might recall, Java is a garbage-collected language. In order for the garbage collector to know which objects are eligible for collection, it needs to keep track of the object graphs. So this is one part of the memory lost to this internal bookkeeping. G1 is especially known for its excessive appetite for additional memory, so be aware of this.
- JIT optimization. Java Virtual Machine optimizes the code during runtime. Again, to know which parts to optimize it needs to keep track of the execution of certain code parts. So again, you are going to lose memory
- Off-heap allocations. If you happen to use off-heap memory, for example while using direct or mapped ByteBuffers yourself or via some clever 3rd party API then voila – you are extending your heap to something you actually cannot control via JVM configuration
- JNI code. When you are using native code, for example in the format of Type 2 database drivers, then again you are loading code in the native memory.
- Metaspace. If you are an early adopter of Java 8, you are using metaspace instead of the good old permgen to store class declarations. This is unlimited and in a native part of the JVM.