
echarts的x軸y軸的顏色改變
阿新 • • 發佈:2019-02-11
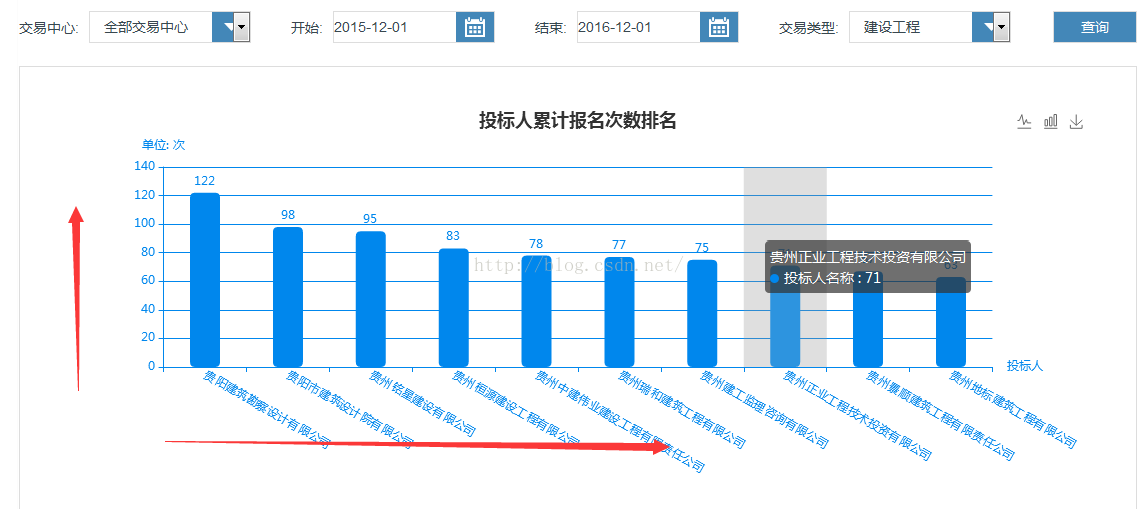
在操作echarts時,需求要求echarts的xy軸的顏色要與圖形的顏色一致。
圖1:
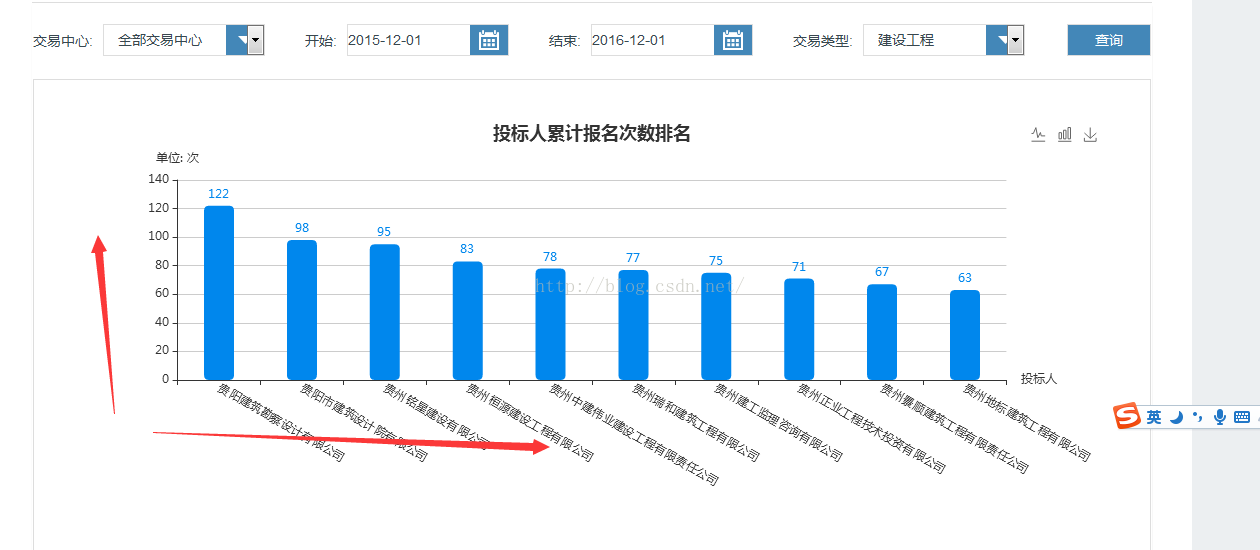
圖2:
解決方案:
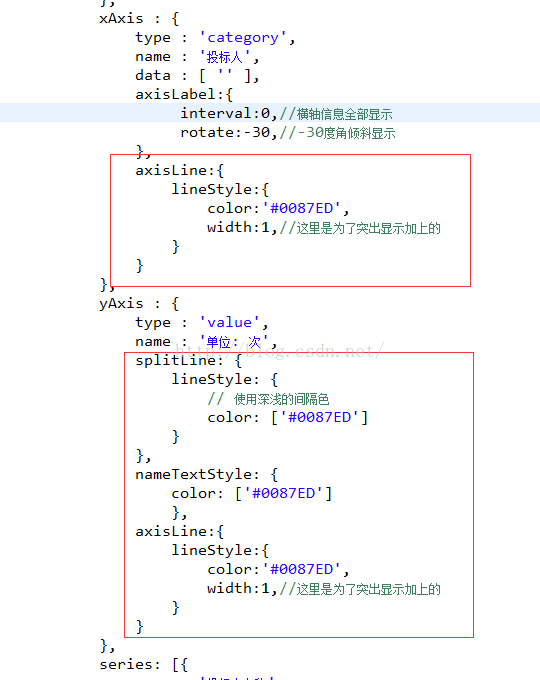
程式碼展示:
圖1:
圖2:
解決方案:
程式碼展示:
var myChart1;
			$(function() {
				document.getElementById("begin1").flatpickr();
	            document.getElementById("end1").flatpickr();
				myChart1 = echarts.init(document.getElementById('mychart1'));
			 	myChart1.showLoading({
		            text : "圖表資料正在努力載入..."
		        });
				//投標人報名次數排前十的資料統計
				var options1 = {
						title : {
							text : '投標人累計報名次數排名',
							x : 'center'
						},
						//color: colorArr,
						tooltip : {
							trigger : 'axis',
							axisPointer : { // 座標軸指示器,座標軸觸發有效
								type : 'shadow' // 預設為直線,可選為:'line' | 'shadow'
							}
						},

		 				toolbox: {
		 			        show : true,
		 			        x:'950',//下載的字型顯示不全
		 			        feature : {
		 			            //dataView : {show: false, readOnly: false},
		 			            magicType : {show: true, type: ['line', 'bar']},
		 			            //restore : {show: true},
		 			            saveAsImage : {show: true}
		 			        }
		 			    },
// 					 legend: {
// 						    	x: 'left',
// 						        data: ['招標代理名稱']
// 							  },
						grid : {
//		 					left : '1%',
//		 					right : '10%',
//		 					bottom : '3%',
//		 					containLabel : true
							y2: 140
						},
						xAxis : {
							type : 'category',
							name : '投標人',
							data : [ '' ],
							axisLabel:{
							     interval:0,//橫軸資訊全部顯示
							     rotate:-30,//-30度角傾斜顯示
							},
							axisLine:{
		                        lineStyle:{
		                            color:'#0087ED',
		                            width:1,//這裡是為了突出顯示加上的
		                        }
		                    }
						},
						yAxis : {
							type : 'value',
							name : '單位: 次',
							splitLine: {
							    lineStyle: {
							        // 使用深淺的間隔色
							        color: ['#0087ED']
							    }
							},
							nameTextStyle: {
								color: ['#0087ED']
								},
							axisLine:{
		                        lineStyle:{
		                            color:'#0087ED',
		                            width:1,//這裡是為了突出顯示加上的
		                        }
		                    }
						},
						series: [{
							name : '投標人名稱',
							type : 'bar',
							stack : '次數',
							label : {
								normal : {
									show : true,
									position: 'top'
								}
							},
							data : [ '' ],
							color:['#0087ED'],
							itemStyle: {
								normal: {
								barBorderRadius: 5,
								}
							},
							barWidth: 30,
						}]
					};
				myChart1.setOption(options1);
				getChartData1();
			});

			function getChartData1() {

				//獲得圖表的options物件
				var newOption1 = myChart1.getOption();
				//引數
				var startDate = $("#begin1").val();
				var endDate = $("#end1").val();
				var type = $("#jylx-type1").val();
				if(type==null || type=="" || type=="undefine"){
		        	type = "${type}";
		        }
				var centerCode = $("#jyzx-all1").val();
				//投標人報名次數排前十的資料統計
				$.ajax({
					type : "post",
					async : false, //同步執行
					url : "bidder!bmcsBar.do",
					data : {
						startDate : startDate,
						endDate : endDate,
						type:type,
						centerCode:centerCode
					},
					dataType : "json", //返回資料形式為json
					success : function(data) {
						if (data) {
							newOption1.xAxis[0].data = data.category;
							newOption1.series[0].data = data.series;
							myChart1.hideLoading();
							myChart1.setOption(newOption1);
						}
					},
					error : function(errorMsg) {
						alert("圖表請求資料失敗啦!");
						myChart1.hideLoading();
					}
				});
			}
			//根據查詢條件載入柱圖
			function showChart1() {
				getChartData1();
			}
			</script>