使用poi和jfreechart生成excel圖表圖片
阿新 • • 發佈:2019-02-12
最近專案在頻繁的操作excel,裡邊涉及到很多和圖表有關的東西。有時候需要使用java操作excel自帶的圖示,比較複雜的我們都是使用excel模板的形式實現。
除此之外,也有一些功能只需要生成對應的圖示樣式的圖片就好,我們實現的時候主要用了兩種方式,一種就是由前臺生成圖片base64碼,然後後臺解碼生成圖片插入到excel,但是這種方式有 一定的侷限性,也就是當某些功能需要後臺定時生成excel的時候,就無法獲取這個圖片。
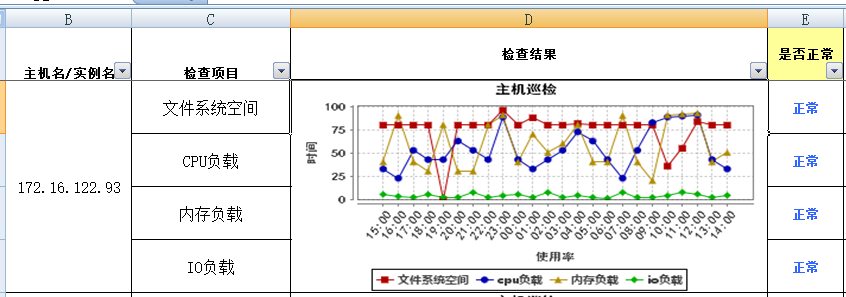
於是我們採用了另一種方法,也就是是用jfreechart生成對應的圖片,然後結合poi插入到excel對應的位置,下圖是專案中使用後的真實效果:
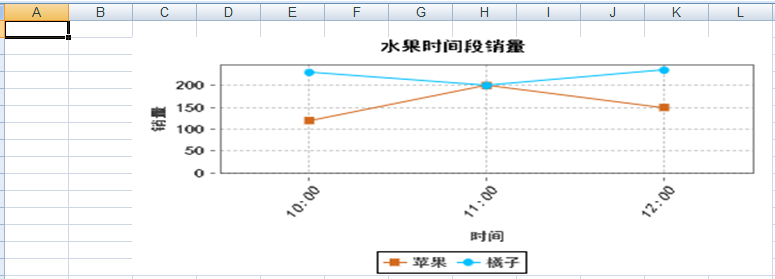
圖1是前端base64碼生成的:

圖2是後臺jfreechart生成的:
以下是抽空做的一個簡單的整理:
1、maven導包:
<dependency>
<groupId>org.apache.poi</groupId>
<artifactId>poi-ooxml</artifactId>
<version>3.8</version>
</dependency>
<dependency>
<groupId>org.apache.poi</groupId 2、java測試main方法程式碼:
package test;
import java.awt.BasicStroke;
import java.awt.Color;
import java.awt.Font;
import java.awt.image.BufferedImage;
import java.io.ByteArrayOutputStream;
import java.io.File;
import java.io.FileOutputStream;
import java.io.IOException;
import java.util.ArrayList;
import java.util.List;
import javax.imageio.ImageIO;
import org.apache.poi.hssf.usermodel.HSSFClientAnchor;
import org.apache.poi.hssf.usermodel.HSSFPatriarch;
import org.apache.poi.hssf.usermodel.HSSFSheet;
import org.apache.poi.hssf.usermodel.HSSFWorkbook;
import org.jfree.chart.ChartColor;
import org.jfree.chart.ChartFactory;
import org.jfree.chart.ChartUtilities;
import org.jfree.chart.JFreeChart;
import org.jfree.chart.axis.CategoryAxis;
import org.jfree.chart.axis.CategoryLabelPositions;
import org.jfree.chart.axis.NumberAxis;
import org.jfree.chart.axis.NumberTickUnit;
import org.jfree.chart.axis.ValueAxis;
import org.jfree.chart.plot.CategoryPlot;
import org.jfree.chart.plot.PlotOrientation;
import org.jfree.chart.renderer.category.LineAndShapeRenderer;
import org.jfree.chart.title.LegendTitle;
import org.jfree.chart.title.TextTitle;
import org.jfree.data.category.DefaultCategoryDataset;
import org.jfree.ui.RectangleEdge;

/**
 * 結合poi和jfreechart建立圖表圖片
 *
 * @author tuzongxun
 * @date 2016年9月19日 上午10:55:09
 */
public class ExcelDemo2 {
    public static void main(String[] args) throws Exception {
        // excel2003工作表
        HSSFWorkbook wb = new HSSFWorkbook();
        HSSFSheet sheet = wb.createSheet("Sheet 1");
        ByteArrayOutputStream byteArrayOut = new ByteArrayOutputStream();
        ;
        // 設定具體資料
        List<String> timeList = new ArrayList<String>();
        timeList.add("10:00");
        timeList.add("11:00");
        timeList.add("12:00");
        List<Integer> appList = new ArrayList<Integer>();
        appList.add(120);
        appList.add(200);
        appList.add(150);
        List<Integer> oraList = new ArrayList<Integer>();
        oraList.add(230);
        oraList.add(200);
        oraList.add(235);
        // 設定圖片中的字型和顏色以及字號
        Font titleFont = new Font("黑體", Font.BOLD, 12);
        Font xfont = new Font("黑體", Font.BOLD, 10);
        Font labelFont = new Font("黑體", Font.BOLD, 10);
        // 設定資料區域
        DefaultCategoryDataset dataset = new DefaultCategoryDataset();
        for (int i = 0; i < timeList.size(); i++) {
            String time = timeList.get(i);
            dataset.addValue(appList.get(i), "蘋果", time);
            dataset.addValue(oraList.get(i), "橘子", time);
        }
        JFreeChart chart = ChartFactory.createLineChart("水果時間段銷量", "時間", "銷量", dataset, PlotOrientation.VERTICAL, true,
            true, true);
        // 設定圖例字型
        chart.getLegend().setItemFont(new Font("黑體", Font.BOLD, 10));
        // 設定標題字型
        chart.setTitle(new TextTitle(chart.getTitle().getText(), titleFont));
        // 圖形的繪製結構物件
        CategoryPlot plot = chart.getCategoryPlot();
        // 獲取顯示線條的物件
        LineAndShapeRenderer lasp = (LineAndShapeRenderer) plot.getRenderer();
        // 設定拐點是否可見/是否顯示拐點
        lasp.setBaseShapesVisible(true);
        // 設定拐點不同用不同的形狀
        lasp.setDrawOutlines(true);
        // 設定線條是否被顯示填充顏色
        lasp.setUseFillPaint(false);
        LineAndShapeRenderer renderer = (LineAndShapeRenderer) plot.getRenderer();
        // 設定折線大小以及折線的顏色
        renderer.setSeriesStroke(0, new BasicStroke(1.0F));
        renderer.setSeriesPaint(0, new Color(210, 105, 30));
        renderer.setSeriesStroke(1, new BasicStroke(1.0F));
        renderer.setSeriesPaint(1, new Color(0, 191, 255));
        // 設定折點的大小
        lasp.setSeriesOutlineStroke(0, new BasicStroke(0.025F));
        lasp.setSeriesOutlineStroke(1, new BasicStroke(0.05F));
        // 設定網格線
        plot.setDomainGridlinePaint(Color.gray);
        plot.setDomainGridlinesVisible(true);
        plot.setRangeGridlinePaint(Color.gray);
        plot.setRangeGridlinesVisible(true);
        // x軸
        CategoryAxis domainAxis = plot.getDomainAxis();
        // 設定x軸不顯示,即讓x軸和資料區重合
        domainAxis.setAxisLineVisible(false);
        // x軸標題
        domainAxis.setLabelFont(xfont);
        // x軸資料傾斜
        domainAxis.setCategoryLabelPositions(CategoryLabelPositions.createUpRotationLabelPositions(0.95D));
        // X軸座標上數值字型
        domainAxis.setTickLabelFont(labelFont);
        // 設定Y軸間隔
        NumberAxis numAxis = (NumberAxis) plot.getRangeAxis();
        numAxis.setTickUnit(new NumberTickUnit(50));
        // y軸
        ValueAxis rangeAxis = plot.getRangeAxis();
        rangeAxis.setLabelFont(xfont);
        // 設定y軸不顯示,即和資料區重合
        rangeAxis.setAxisLineVisible(false);
        // y軸座標上數值字型
        rangeAxis.setTickLabelFont(labelFont);
        rangeAxis.setFixedDimension(0);
        CategoryPlot cp = chart.getCategoryPlot();
        // 背景色設定
        cp.setBackgroundPaint(ChartColor.WHITE);
        cp.setRangeGridlinePaint(ChartColor.GRAY);
        // 建立圖例,設定圖例的位置,這裡的設定實際不起作用,怎麼設都在下邊
        LegendTitle legendTitle = new LegendTitle(chart.getPlot());
        legendTitle.setPosition(RectangleEdge.BOTTOM);
        try {
            ChartUtilities.writeChartAsPNG(byteArrayOut, chart, 400, 200);
            String fileSavePath = "exTest.png";
            BufferedImage bufferImg = ImageIO.read(new File(fileSavePath));
            ImageIO.write(bufferImg, "png", byteArrayOut);
        } catch (IOException e) {
        }
        // 畫圖的頂級管理器,一個sheet只能獲取一個(一定要注意這點)
        HSSFPatriarch patriarch = sheet.createDrawingPatriarch();
        // 八個引數,前四個表示圖片離起始單元格和結束單元格邊緣的位置,
        // 後四個表示起始和結束單元格的位置,如下表示從第2列到第12列,從第1行到第15行,需要注意excel起始位置是0
        HSSFClientAnchor anchor = new HSSFClientAnchor(0, 0, 0, 0, (short) 2, (short) 1, (short) 12, (short) 15);
        anchor.setAnchorType(3);
        // 插入圖片
        patriarch.createPicture(anchor, wb.addPicture(byteArrayOut.toByteArray(), HSSFWorkbook.PICTURE_TYPE_PNG));
        // excel2003字尾
        FileOutputStream fileOut = new FileOutputStream("exTest.xls");
        wb.write(fileOut);
        fileOut.close();
    }
}
結果如圖: