matplotlib.legend()函式用法解析
1.圖例legend基礎語法及用法
legend語法引數如下: matplotlib.pyplot.legend(*args, **kwargs)
|
Keyword |
Description |
|
loc |
Location code string, or tuple (see below).圖例所有figure位置 |
|
prop |
the font property字型引數 |
|
fontsize |
the font size (used only if prop is not specified) |
|
markerscale |
the relative size of legend markers vs. original 圖例標記與原始標記的相對大小 |
|
markerfirst |
If True (default), marker is to left of the label. 如果為True,則圖例標記位於圖例標籤的左側 |
|
numpoints |
the number of points in the legend for line 為線條圖圖例條目建立的標記點數 |
|
scatterpoints |
the number of points in the legend for scatter plot
為散點圖圖例條目建立的標記點數 |
|
scatteryoffsets |
a list of yoffsets for scatter symbols in legend
為散點圖圖例條目建立的標記的垂直偏移量 |
|
frameon |
If True, draw the legend on a patch (frame).
控制是否應在圖例周圍繪製框架 |
|
fancybox |
If True, draw the frame with a round fancybox.
控制是否應在構成圖例背景的FancyBboxPatch周圍啟用圓邊 |
|
shadow |
If True, draw a shadow behind legend.
控制是否在圖例後面畫一個陰影 |
|
framealpha |
Transparency of the frame.
控制圖例框架的 Alpha 透明度 |
|
edgecolor |
Frame edgecolor. |
|
facecolor |
Frame facecolor. |
|
ncol |
number of columns 設定圖例分為n列展示 |
|
borderpad |
the fractional whitespace inside the legend border
圖例邊框的內邊距 |
|
labelspacing |
the vertical space between the legend entries
圖例條目之間的垂直間距 |
|
handlelength |
the length of the legend handles
圖例控制代碼的長度 |
|
handleheight |
the height of the legend handles
圖例控制代碼的高度 |
|
handletextpad |
the pad between the legend handle and text
圖例控制代碼和文字之間的間距 |
|
borderaxespad |
the pad between the axes and legend border 軸與圖例邊框之間的距離 |
|
columnspacing |
the spacing between columns 列間距 |
|
title |
the legend title |
|
bbox_to_anchor |
the bbox that the legend will be anchored.指定圖例在軸的位置 |
|
bbox_transform |
the transform for the bbox. transAxes if None. |
(1)設定圖例位置
使用loc引數
plt.legend(loc='lower left')
|
0: ‘best' 1: ‘upper right' 2: ‘upper left' 3: ‘lower left' |
4: ‘lower right' 5: ‘right' 6: ‘center left' |
7: ‘center right' 8: ‘lower center' 9: ‘upper center' 10: ‘center' |
(2)設定圖例字型
#設定字型大小
fontsize : int or float or {‘xx-small’, ‘x-small’, ‘small’, ‘medium’, ‘large’, ‘x-large’, ‘xx-large’}
(3)設定圖例邊框及背景
plt.legend(loc='best',frameon=False) #去掉圖例邊框
plt.legend(loc='best',edgecolor='blue') #設定圖例邊框顏色
plt.legend(loc='best',facecolor='blue') #設定圖例背景顏色,若無邊框,引數無效
(4)設定圖例標題
plt.legend(loc='best',title='figure 1 legend') #去掉圖例邊框
2.legend面向物件命令
(1)獲取並設定legend圖例
plt.legend(loc=0, numpoints=1)
leg = plt.gca().get_legend() #或leg=ax.get_legend()
ltext = leg.get_texts()
plt.setp(ltext, fontsize=12,fontweight='bold')
(2)設定圖例
legend = ax.legend((rectsTest1, rectsTest2, rectsTest3), ('test1', 'test2', 'test3'))
legend = ax.legend(loc='upper center', shadow=True, fontsize='x-large')
legend.get_frame().set_facecolor('red') #設定圖例legend背景為紅色
frame = legend.get_frame()
frame.set_alpha(1)
frame.set_facecolor('none') #設定圖例legend背景透明
(3)移除圖例
ax1.legend_.remove() ##移除子圖ax1中的圖例
ax2.legend_.remove() ##移除子圖ax2中的圖例
ax3.legend_.remove() ##移除子圖ax3中的圖例
3.案例:設定圖例legend到圖形邊界外
-
#主要是bbox_to_anchor的使用 -
box = ax1.get_position() -
ax1.set_position([box.x0, box.y0, box.width , box.height* 0.8]) -
ax1.legend(loc='center', bbox_to_anchor=(0.5, 1.2),ncol=3)
4.案例:顯示多圖例legend
-
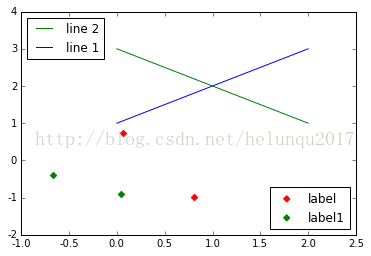
import matplotlib.pyplot as plt -
import numpy as np -
x = np.random.uniform(-1, 1, 4) -
y = np.random.uniform(-1, 1, 4) -
p1, = plt.plot([1,2,3]) -
p2, = plt.plot([3,2,1]) -
l1 = plt.legend([p2, p1], ["line 2", "line 1"], loc='upper left') -
p3 = plt.scatter(x[0:2], y[0:2], marker = 'D', color='r') -
p4 = plt.scatter(x[2:], y[2:], marker = 'D', color='g') -
# This removes l1 from the axes. -
plt.legend([p3, p4], ['label', 'label1'], loc='lower right', scatterpoints=1) -
# Add l1 as a separate artist to the axes -
plt.gca().add_artist(l1)
-
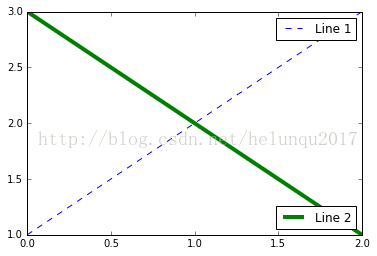
import matplotlib.pyplot as plt -
line1, = plt.plot([1,2,3], label="Line 1", linestyle='--') -
line2, = plt.plot([3,2,1], label="Line 2", linewidth=4) -
# 為第一個線條建立圖例 -
first_legend = plt.legend(handles=[line1], loc=1) -
# 手動將圖例新增到當前軸域 -
ax = plt.gca().add_artist(first_legend) -
# 為第二個線條建立另一個圖例 -
plt.legend(handles=[line2], loc=4) -
plt.show()