關於MPAndroidChart記錄幾個問題
近期需要有一個曲線圖表的需求,最前的圖表功能的自定義View寫,感覺效能上不過關,所以這次使用那個*炸天的Android圖表宇宙無敵開源庫MPAndroidChart,憑著中學生英語的水平大致看了下文件。
還是自己好好擼原始碼吧,MPAndroidChart其實已經封裝的很好了,API也很易懂,但是有一些細節需要改動原始碼,希望可以幫到大家,先看看MPAndroidChart的包。
只選標了幾個,其實包名已經超清楚了,其實Utils裡就有很多幹貨,計算Text的高度等方法很好用,當然常做自定義控制元件的朋友應該都很熟悉了。
由於直接用的公司程式碼,所以沒有整段的貼。。。。好了,開始擼程式碼。
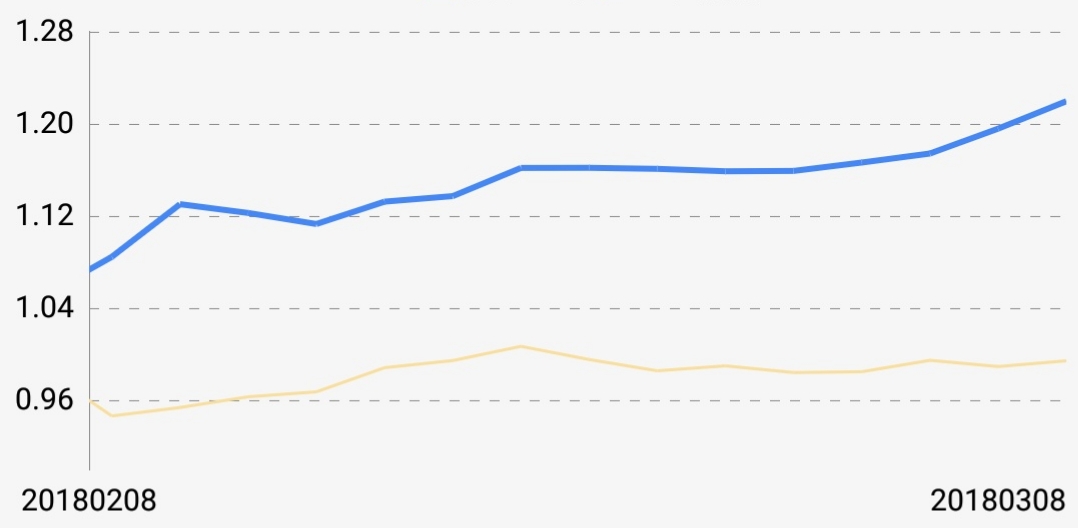
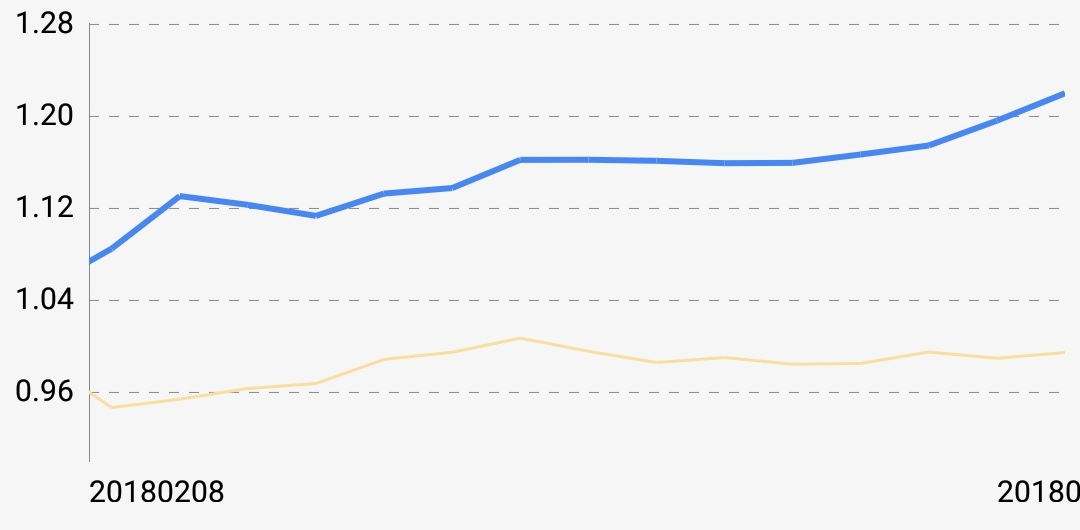
很簡單一個demo,這裡可能有兩個問題,我在看相關文件的時候看見過有一些同學問過一個問題,Line模式的圖怎麼讓它一出來就呈現縮放的狀態,而且要支援手勢。這裡其實是用的ViewPortHandler類做的處理,這個類作者宣告必須要仔細閱讀文件之後再使用,否則容易出現問題,真是嚇屎了好吧。ViewPortHandler內部包含一個Matrix物件,拿這個Matrix就可以對Line做一些操作了。此處參考了gogooing的處理方式。
private void setHandler(CombinedChart combinedChart) {
        final ViewPortHandler viewPortHandlerBar = combinedChart.getViewPortHandler();
        viewPortHandlerBar.setMaximumScaleX(3);//最大縮放因子。
        Matrix touchmatrix = viewPortHandlerBar.getMatrixTouch();
        final float xscale = 3;
        touchmatrix.postScale(xscale, 1f);
}
這個方法在資料載入設定完之後呼叫,然後還需要一步操作,因為這個時候你會發現,你的線是從頭開始的,一般初始顯示都希望是顯示最後一根。
setHandler(mChartPrice);
mChartPrice.moveViewToX(Data.size() - 1);
哈哈,最後移動一下就好啦。
另外一個問題是,最左邊labels如果過長的話就會被擋住一半。
其實原始碼是做過Label超出螢幕的處理,結果最後一個Label的判斷一直沒有走進去過,把i == mXAxis.mEntryCount - 1改為i == mXAxis.mEntryCount就可以了,這裡不知道是不是有什麼問題,總之哪個判斷就是進不去。
/**
     * draws the x-labels on the specified y-position
     *
     * @param pos
     */
    protected void drawLabels(Canvas c, float pos, MPPointF anchor) {
        ........//省略N行程式碼
        for (int i = 0; i < positions.length; i += 2) {
            float x = positions[i];
            if (mViewPortHandler.isInBoundsX(x)) {
                String label = mXAxis.getValueFormatter().getFormattedValue(mXAxis.mEntries[i / 2], mXAxis);
                //這個判斷裡是處理第一個和最後一個labels,當然也可以自己寫。
                if (mXAxis.isAvoidFirstLastClippingEnabled()) {
                    // avoid clipping of the last
                    if (i == mXAxis.mEntryCount - 1 && mXAxis.mEntryCount > 1) {
                        float width = Utils.calcTextWidth(mAxisLabelPaint, label);
                        if (width > mViewPortHandler.offsetRight() * 2
                                && x + width > mViewPortHandler.getChartWidth())
                            x -= width / 2;
                        // avoid clipping of the first
                    } else if (i == 0) {
                            //第一個點不做操作
//                        float width = Utils.calcTextWidth(mAxisLabelPaint, label);
//                        x += width / 2;
                    }
                }
                drawLabel(c, label, x, pos, anchor, labelRotationAngleDegrees);
            }
        }
    }
顯示的問題解決了,還有是事件問題,MPAndroidChart提供的手勢很多,但是Highlight的手勢很單一,直接在Chart上滑動就可以觸發Highlight顯示,還有Chart縮放的時候好像是不能出現Highlight的,個人觀察是這樣,那就只能改原始碼了,我們希望可以長按顯示Highlight,並且鬆開手Highlight消失。
這個庫的包名都可以很好的幫助理解功能,關於繪製的類都在renderer包下面,關於手勢很容易聯想帶listener,沒錯就是listener包下的BarLineChartTouchListener(折線圖是這個)。onTouch方法簡直不要太熟悉,手勢操作就在這了,200行左右很少,邏輯也很清楚。我們在MotionEvent.ACTION_MOVE裡面做改動。可以看到這個類裡面還有一個onLongPress方法,這個是系統類GestureDetector內部類SimpleOnGestureListener的一個長按事件的回撥方法。現在我們找一個標誌位,來標記長按事件,事實上可以直接拿SimpleOnGestureListener裡的mLastGesture來用。直接新增5-8行處的程式碼,這就解決了縮放狀態下不能是使用Highlight的問題。然後擡手的時候就是在ACTION_CANCEL、ACTION_POINTER_UP、ACTION_POINTER_UP中加入mChart.highlightValue(null);mLastGesture=ChartGesture.NONE;兩句程式碼,把標誌位和Highlight復原即可。
先記錄這幾個問題- -。@SuppressLint("ClickableViewAccessibility") @Override public boolean onTouch(View v, MotionEvent event) { case MotionEvent.ACTION_MOVE: if (mLastGesture==ChartGesture.LONG_PRESS){ performHighlightDrag(event); break; } if (mTouchMode == DRAG) { mChart.disableScroll(); float x = mChart.isDragXEnabled() ? event.getX() - mTouchStartPoint.x : 0.f; float y = mChart.isDragYEnabled() ? event.getY() - mTouchStartPoint.y : 0.f; performDrag(event, x, y); } else if (mTouchMode == X_ZOOM || mTouchMode == Y_ZOOM || mTouchMode == PINCH_ZOOM) { mChart.disableScroll(); if (mChart.isScaleXEnabled() || mChart.isScaleYEnabled()) performZoom(event); } else if (mTouchMode == NONE && Math.abs(distance(event.getX(), mTouchStartPoint.x, event.getY(), mTouchStartPoint.y)) > mDragTriggerDist) { if (mChart.isDragEnabled()) { boolean shouldPan = !mChart.isFullyZoomedOut() || !mChart.hasNoDragOffset(); if (shouldPan) { float distanceX = Math.abs(event.getX() - mTouchStartPoint.x); float distanceY = Math.abs(event.getY() - mTouchStartPoint.y); // Disable dragging in a direction that's disallowed if ((mChart.isDragXEnabled() || distanceY >= distanceX) && (mChart.isDragYEnabled() || distanceY <= distanceX)) { mLastGesture = ChartGesture.DRAG; mTouchMode = DRAG; } } else { if (mChart.isHighlightPerDragEnabled()) { mLastGesture = ChartGesture.DRAG; if (mChart.isHighlightPerDragEnabled()) performHighlightDrag(event); } } } } break; case MotionEvent.ACTION_UP: final VelocityTracker velocityTracker = mVelocityTracker; final int pointerId = event.getPointerId(0); velocityTracker.computeCurrentVelocity(1000, Utils.getMaximumFlingVelocity()); final float velocityY = velocityTracker.getYVelocity(pointerId); final float velocityX = velocityTracker.getXVelocity(pointerId); if (Math.abs(velocityX) > Utils.getMinimumFlingVelocity() || Math.abs(velocityY) > Utils.getMinimumFlingVelocity()) { if (mTouchMode == DRAG && mChart.isDragDecelerationEnabled()) { stopDeceleration(); mDecelerationLastTime = AnimationUtils.currentAnimationTimeMillis(); mDecelerationCurrentPoint.x = event.getX(); mDecelerationCurrentPoint.y = event.getY(); mDecelerationVelocity.x = velocityX; mDecelerationVelocity.y = velocityY; Utils.postInvalidateOnAnimation(mChart); // This causes computeScroll to fire, recommended for this by // Google } } if (mTouchMode == X_ZOOM || mTouchMode == Y_ZOOM || mTouchMode == PINCH_ZOOM || mTouchMode == POST_ZOOM) { // Range might have changed, which means that Y-axis labels // could have changed in size, affecting Y-axis size. // So we need to recalculate offsets. mChart.calculateOffsets(); mChart.postInvalidate(); } mTouchMode = NONE; mChart.enableScroll(); if (mVelocityTracker != null) { mVelocityTracker.recycle(); mVelocityTracker = null; } endAction(event); break; case MotionEvent.ACTION_POINTER_UP: Utils.velocityTrackerPointerUpCleanUpIfNecessary(event, mVelocityTracker); mTouchMode = POST_ZOOM; break; case MotionEvent.ACTION_CANCEL: mTouchMode = NONE; endAction(event); break; } // perform the transformation, update the chart mMatrix = mChart.getViewPortHandler().refresh(mMatrix, mChart, true); return true; // indicate event was handled } @Override public void onLongPress(MotionEvent e) { mLastGesture = ChartGesture.LONG_PRESS; OnChartGestureListener l = mChart.getOnChartGestureListener(); if (l != null) { l.onChartLongPressed(e); } }