
Matlab畫圖函式與引數
Matlab畫圖函式及引數
學習資料方便查閱。
plot函式
plot是繪製一維曲線的基本函式,但在使用此函式之前,我們需先定義曲線上每一點的x及y座標。下例可畫出一條正弦曲線:
close all;
x=linspace(0, 2*pi, 100); % 100個點的x座標
y=sin(x); % 對應的y座標
plot(x,y);
若要畫出多條曲線,只需將座標對依次放入plot函式即可:plot(x, sin(x), x, cos(x));
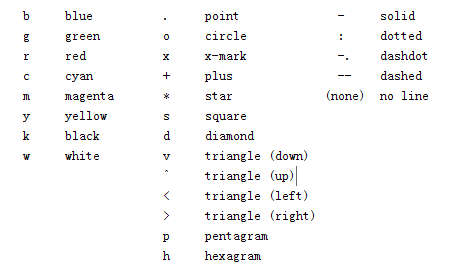
若要改變顏色,在座標對後面加上相關字串即可:
plot(x, sin(x), ‘c’, x, cos(x), ‘g’);若要同時改變顏色及圖線型態(Line style),也是在座標對後面加上相關字串即可:
plot(x, sin(x), ‘co’, x, cos(x), ‘g*’);
引數設定如圖:
座標與註解
axis([xmin,xmax,ymin,ymax])函式來調整圖軸的範圍:
axis([0, 6, -1.2, 1.2]);
此外,MATLAB也可對圖形加上各種註解與處理:
xlabel(‘Input Value’); % x軸註解
ylabel(‘Function Value’); % y軸註解
title(‘Two Trigonometric Functions’);
legend(‘y = sin(x)’,’y = cos(x)’); % 圖形註解
grid on; % 顯示格線
subplot
我們可用subplot來同時畫出數個小圖形於同一個視窗之中:
subplot(2,2,1); plot(x, sin(x));
subplot(2,2,2); plot(x, cos(x));
subplot(2,2,3); plot(x, sinh(x));
subplot(2,2,4); plot(x, cosh(x));
plot3(三維直線函式)
例:繪引數方程 x=t;y=sin(t);z=cos(t) 的空間曲線
clf
t=0:0.05:100;
x=t;y=sin(t);z=sin(2*t);
plot3(x,y,z,’b:’)
柱狀圖
y = [ 1.072 0.852 0.539 0.628;
3.688 3.154 1.325 1.652;
5.467 5.033 3.658 4.103];
hArray = bar(y,0.8); //0.8是柱狀圖寬度