
kubernetes監控告警詳解
1. 概述
1.1 總體目標
從監控平臺本身的業務需求分析來看,我們至少應該希望通過Prometheus平臺獲取到以下監控資料:
效能指標
1.容器相關的效能指標資料(如:cpu, memory, filesystem)
2.Pod相關的效能指標資料
3.主機節點相關的效能指標資料服務健康狀態
1.Deployment相關的健康狀態(health or unhealth)
2.Pod的健康狀態
3.主機Node節點的健康狀態
除了獲取監控資料意外,我們還需要對一些特定的異常情況進行告警,因此需要配合使用AlertManager使用告警通知。
1.2 主流監控方案
目前對於kubernetes的主流監控方案主要有以下兩種:
- heapster+influxDB
heapster為k8s而生,它從apiserver獲取節點資訊,每個節點的kubelet內含cAdvisor,暴露出api,heapster通過訪問這些端點得到容器監控資料。它支援多種儲存方式,常用的的是influxDB。這套方案的缺點是缺乏報警等功能以及influxDB的單點問題。 - prometheus
本方案下文詳細敘述。
2. 實現思路和要點
2.1 容器和Pod相關的效能指標資料—cadvisor
cAdvisor是谷歌開源的一個容器監控工具,目前cAdvisor整合到了kubelet元件內,可以在kube叢集中每個啟動了kubelet的節點使用cAdvisor來檢視該節點的執行資料。因此可以直接用過cAdvisor提供的metrics介面獲取到所有容器相關的效能指標資料。
該工具提供了webUI和REST API兩種方式來展示資料,從而可以幫助管理者瞭解主機以及容器的資源使用情況和效能資料。cAdvisor對外提供web服務的預設埠為4194(http://nodeIP:4194,prometheus格式資料提供介面:nodeIP:4194/metrics),rest API服務埠預設為.
prometheus獲取監控端點的方式有很多,其中就包括k8s,prometheu會通過呼叫master的apiserver獲取到節點資訊,然後去調取每個節點的資料。
prometheus作為一個時間序列資料收集,處理,儲存的服務,能夠監控的物件必須直接或間接提供prometheus認可的資料模型,通過http api的形式暴露出來。我們知道cAdvisor支援prometheus,同樣,包含了cAdivisor的kubelet也支援prometheus。每個節點都暴露了供prometheus呼叫的api。
- 檢視資料nodeIP:4194/metrics,可以看到是按prometheus的格式輸出的資料:
# HELP cadvisor_version_info A metric with a constant '1' value labeled by kernel version, OS version, docker version, cadvisor version & cadvisor revision.
# TYPE cadvisor_version_info gauge
cadvisor_version_info{cadvisorRevision="",cadvisorVersion="",dockerVersion="1.12.3",kernelVersion="4.9.0-1.2.el7.bclinux.x86_64",osVersion="Debian GNU/Linux 8 (jessie)"} 1
# HELP container_cpu_cfs_periods_total Number of elapsed enforcement period intervals.
# TYPE container_cpu_cfs_periods_total counter
container_cpu_cfs_periods_total{container_name="",id="/kubepods/burstable/pod5aec9dff0e41760e3c9b421bc9d034fa",image="",name="",namespace="",pod_name=""} 3.0160829e+07
container_cpu_cfs_periods_total{container_name="",id="/kubepods/burstable/poda8a515dcc2d15d092f28266ae34e1d62",image="",name="",namespace="",pod_name=""} 4.016655e+06
container_cpu_cfs_periods_total{container_name="",id="/kubepods/burstable/podafbe65981008ac38e2634ceba6169a4e",image="",name="",namespace="",pod_name=""} 2.401024e+07
container_cpu_cfs_periods_total{container_name="",id="/kubepods/burstable/podef773c7b69c2891d314706653809c4c7",image="",name="",namespace="",pod_name=""} 8.793728e+06
container_cpu_cfs_periods_total{container_name="",id="/kubepods/pod5f9a1823-fb84-11e7-85c5-00505694b7e8",image="",name="",namespace="",pod_name=""} 47539
container_cpu_cfs_periods_total{container_name="kube-apiserver",id="/kubepods/burstable/pod5aec9dff0e41760e3c9b421bc9d034fa/36cb499de1f4fc407decc7264dc58b307cde1821ad3b0f02727761b27dbfda22",image="quay.io/coreos/[email protected]:489401d5cc14505c0baecedff7b16301e70322eb6c03157a5a40a95e8b376bac",name="k8s_kube-apiserver_kube-apiserver-k8smaster01_kube-system_5aec9dff0e41760e3c9b421bc9d034fa_0",namespace="kube-system",pod_name="kube-apiserver-k8smaster01"} 2.0525293e+07
container_cpu_cfs_periods_total{container_name="kube-controller-manager",id="/kubepods/burstable/poda8a515dcc2d15d092f28266ae34e1d62/4b8b29de375e8a2475e8c53d98b8da3bb7df7ea1f251321b814afc1e41e5074b",image="quay.io/coreos/[email protected]:489401d5cc14505c0baecedff7b16301e70322eb6c03157a5a40a95e8b376bac",name="k8s_kube-controller-manager_kube-controller-manager-k8smaster01_kube-system_a8a515dcc2d15d092f28266ae34e1d62_6",namespace="kube-system",pod_name="kube-controller-manager-k8smaster01"} 1.630663e+06
container_cpu_cfs_periods_total{container_name="kube-proxy",id="/kubepods/burstable/podef773c7b69c2891d314706653809c4c7/0628a30f38ba31446f4ed2db2b011c577158be780a36c312df6215ff3b31ee49",image="quay.io/coreos/[email protected]:489401d5cc14505c0baecedff7b16301e70322eb6c03157a5a40a95e8b376bac",name="k8s_kube-proxy_kube-proxy-k8smaster01_kube-system_ef773c7b69c2891d314706653809c4c7_4",namespace="kube-system",pod_name="kube-proxy-k8smaster01"} 8.793785e+06
container_cpu_cfs_periods_total{container_name="kube-scheduler",id="/kubepods/burstable/podafbe65981008ac38e2634ceba6169a4e/a04e8db7b213951d25850a3e947ace4d60a1d08e14afb074745977647b26b545",image="quay.io/coreos/[email protected]:489401d5cc14505c0baecedff7b16301e70322eb6c03157a5a40a95e8b376bac",name="k8s_kube-scheduler_kube-scheduler-k8smaster01_kube-system_afbe65981008ac38e2634ceba6169a4e_6",namespace="kube-system",pod_name="kube-scheduler-k8smaster01"} 2.1163397e+07
...- 1
- 2
- 3
- 4
- 5
- 6
- 7
- 8
- 9
- 10
- 11
- 12
- 13
- 14
- 15
在prometheus的target中可以看到採到的資訊:
備註:在1.7.3以後版本中cadvisor的metrics被從kubelet metrics的endpoint中獨立出來了,在prometheus採集的時候變成兩個scrape的job
2.2 主機節點效能指標資料—node-exporter
Prometheus社群提供的NodeExporter專案可以對於主機的關鍵度量指標狀態監控,通過kubernetes的Deamon Set我們可以確保在各個主機節點上部署單獨的NodeExporter例項,從而實現對主機資料的監控
apiVersion: extensions/v1beta1
kind: DaemonSet
metadata:
  name: prometheus-node-exporter
  namespace: kube-system
  labels:
    app: prometheus-node-exporter
spec:
  template:
    metadata:
      name: prometheus-node-exporter
      labels:
        app: prometheus-node-exporter
    spec:
      containers:
      - image: prom/node-exporter:v0.15.0
        imagePullPolicy: IfNotPresent
        name: prometheus-node-exporter
        ports:
        - name: prom-node-exp
          #^ must be an IANA_SVC_NAME (at most 15 characters, ..)
          containerPort: 9100
          hostPort: 9100
      tolerations:
      - key: "master"
        operator: "Equal"
        value: "true"
        effect: "NoSchedule"
      hostNetwork: true
      hostPID: true
      restartPolicy: Always
---
apiVersion: v1
kind: Service
metadata:
  annotations:
    prometheus.io/scrape: 'true'
  name: prometheus-node-exporter
  namespace: kube-system
  labels:
    app: prometheus-node-exporter
spec:
  clusterIP: None
  ports:
    - name: prometheus-node-exporter
      port: 9100
      protocol: TCP
  selector:
    app: prometheus-node-exporter
type: ClusterIP- 1
- 2
- 3
- 4
- 5
- 6
- 7
- 8
- 9
- 10
- 11
- 12
- 13
- 14
- 15
- 16
- 17
- 18
- 19
- 20
- 21
- 22
- 23
- 24
- 25
- 26
- 27
- 28
- 29
- 30
- 31
- 32
- 33
- 34
- 35
- 36
- 37
- 38
- 39
- 40
- 41
- 42
- 43
- 44
- 45
- 46
- 47
- 48
- 49
- 50
備註:
1.在Service中定義標註prometheus.io/scrape: ‘true’,表明該Service需要被promethues發現並採集資料
2.Promethues可以在容器內通過DNS地址 https://kubernetes.default.svc 訪問kubernetes的Rest API.
3.node-exporter使用hostNetwork模式檢視資料:nodeIP:9100/metrics,可以看到是按prometheus的格式輸出的資料:
# HELP go_gc_duration_seconds A summary of the GC invocation durations.
# TYPE go_gc_duration_seconds summary
go_gc_duration_seconds{quantile="0"} 3.4159e-05
go_gc_duration_seconds{quantile="0.25"} 4.5062e-05
go_gc_duration_seconds{quantile="0.5"} 5.6108e-05
go_gc_duration_seconds{quantile="0.75"} 7.5753e-05
go_gc_duration_seconds{quantile="1"} 0.000627203
go_gc_duration_seconds_sum 3.606392117
go_gc_duration_seconds_count 22665
# HELP go_goroutines Number of goroutines that currently exist.
# TYPE go_goroutines gauge
go_goroutines 14
# HELP go_info Information about the Go environment.
# TYPE go_info gauge
go_info{version="go1.9.1"} 1
# HELP go_memstats_alloc_bytes Number of bytes allocated and still in use.
# TYPE go_memstats_alloc_bytes gauge
go_memstats_alloc_bytes 1.291248e+06
# HELP go_memstats_alloc_bytes_total Total number of bytes allocated, even if freed.
# TYPE go_memstats_alloc_bytes_total counter
...- 1
- 2
- 3
- 4
- 5
- 6
- 7
- 8
- 9
- 10
- 11
- 12
- 13
- 14
- 15
- 16
- 17
- 18
- 19
- 20
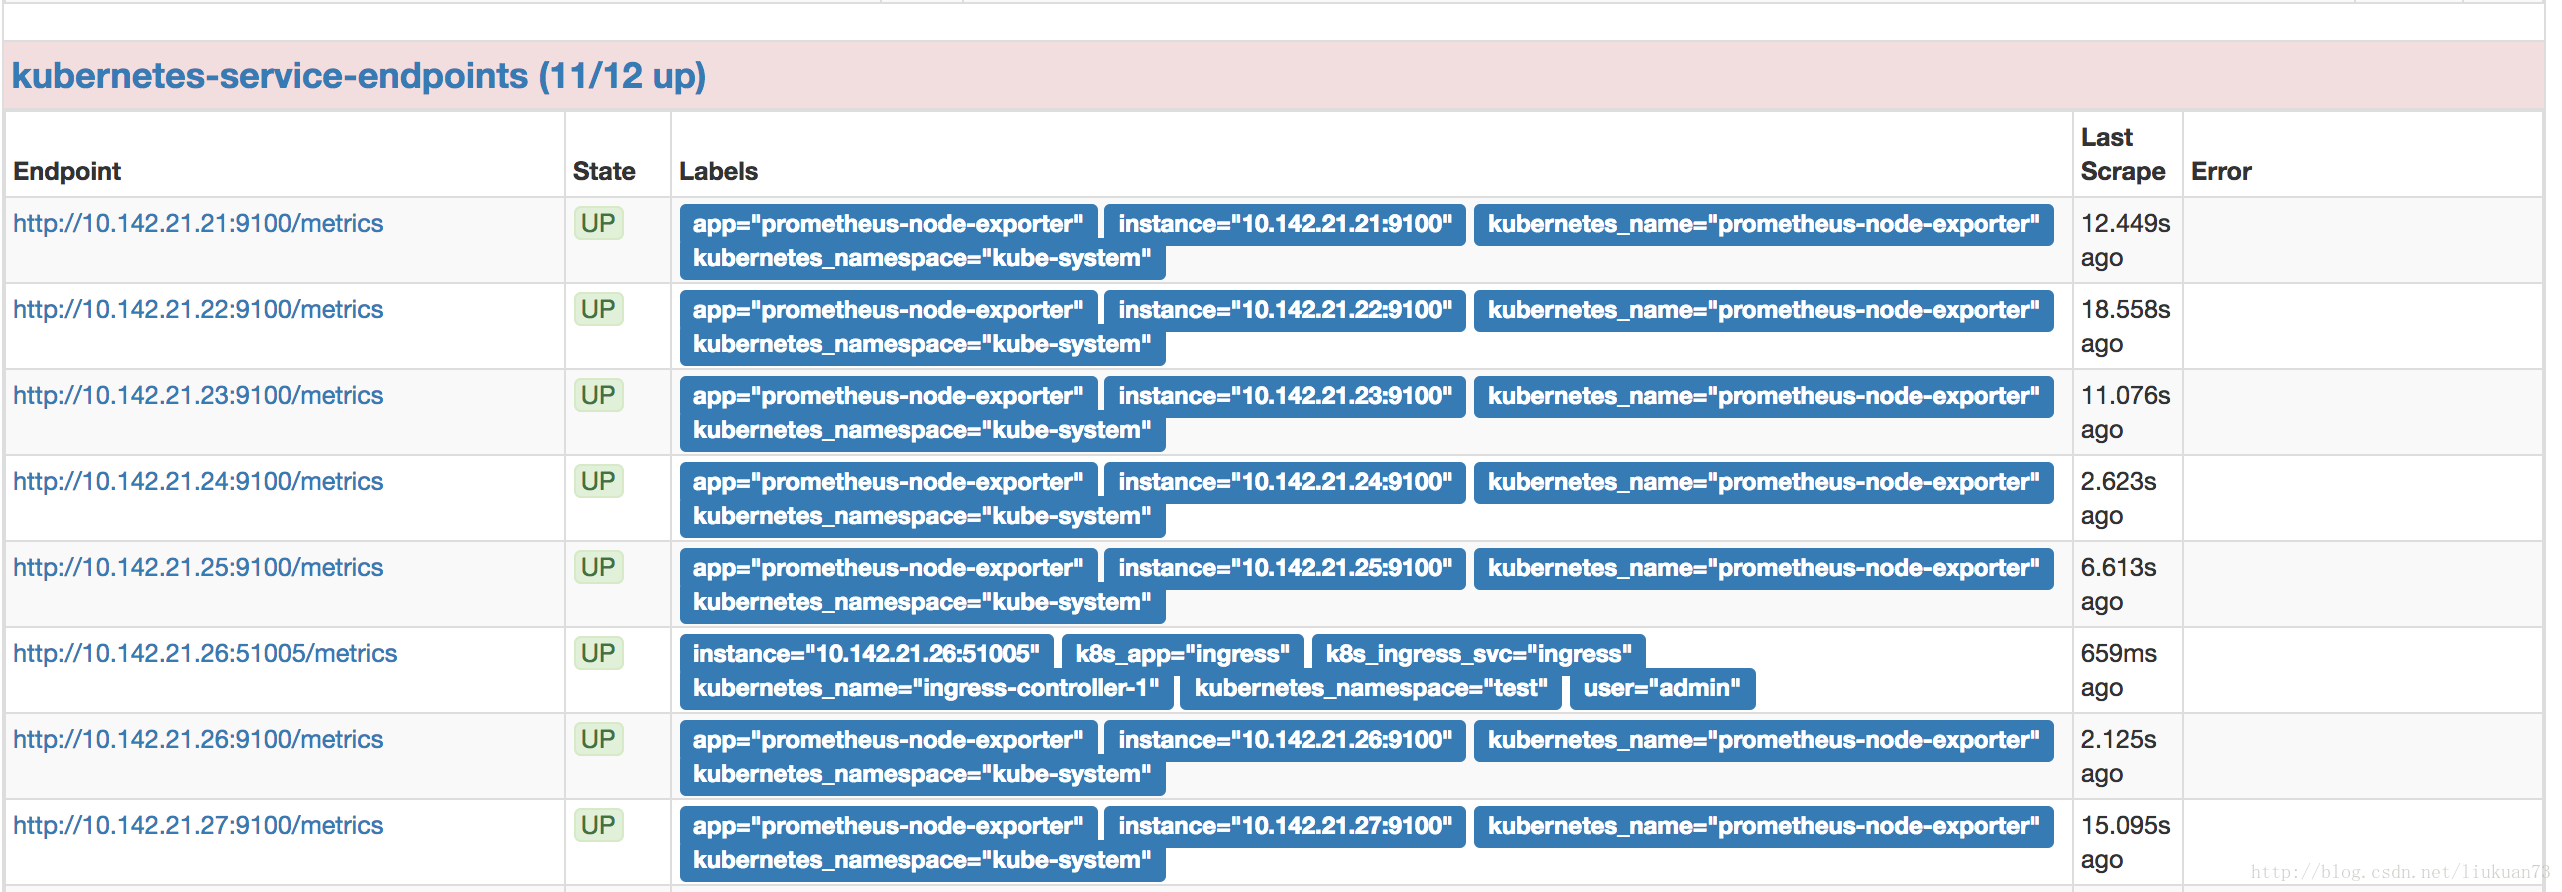
- 21
- 在prometheus的target中可以看到採到資訊:
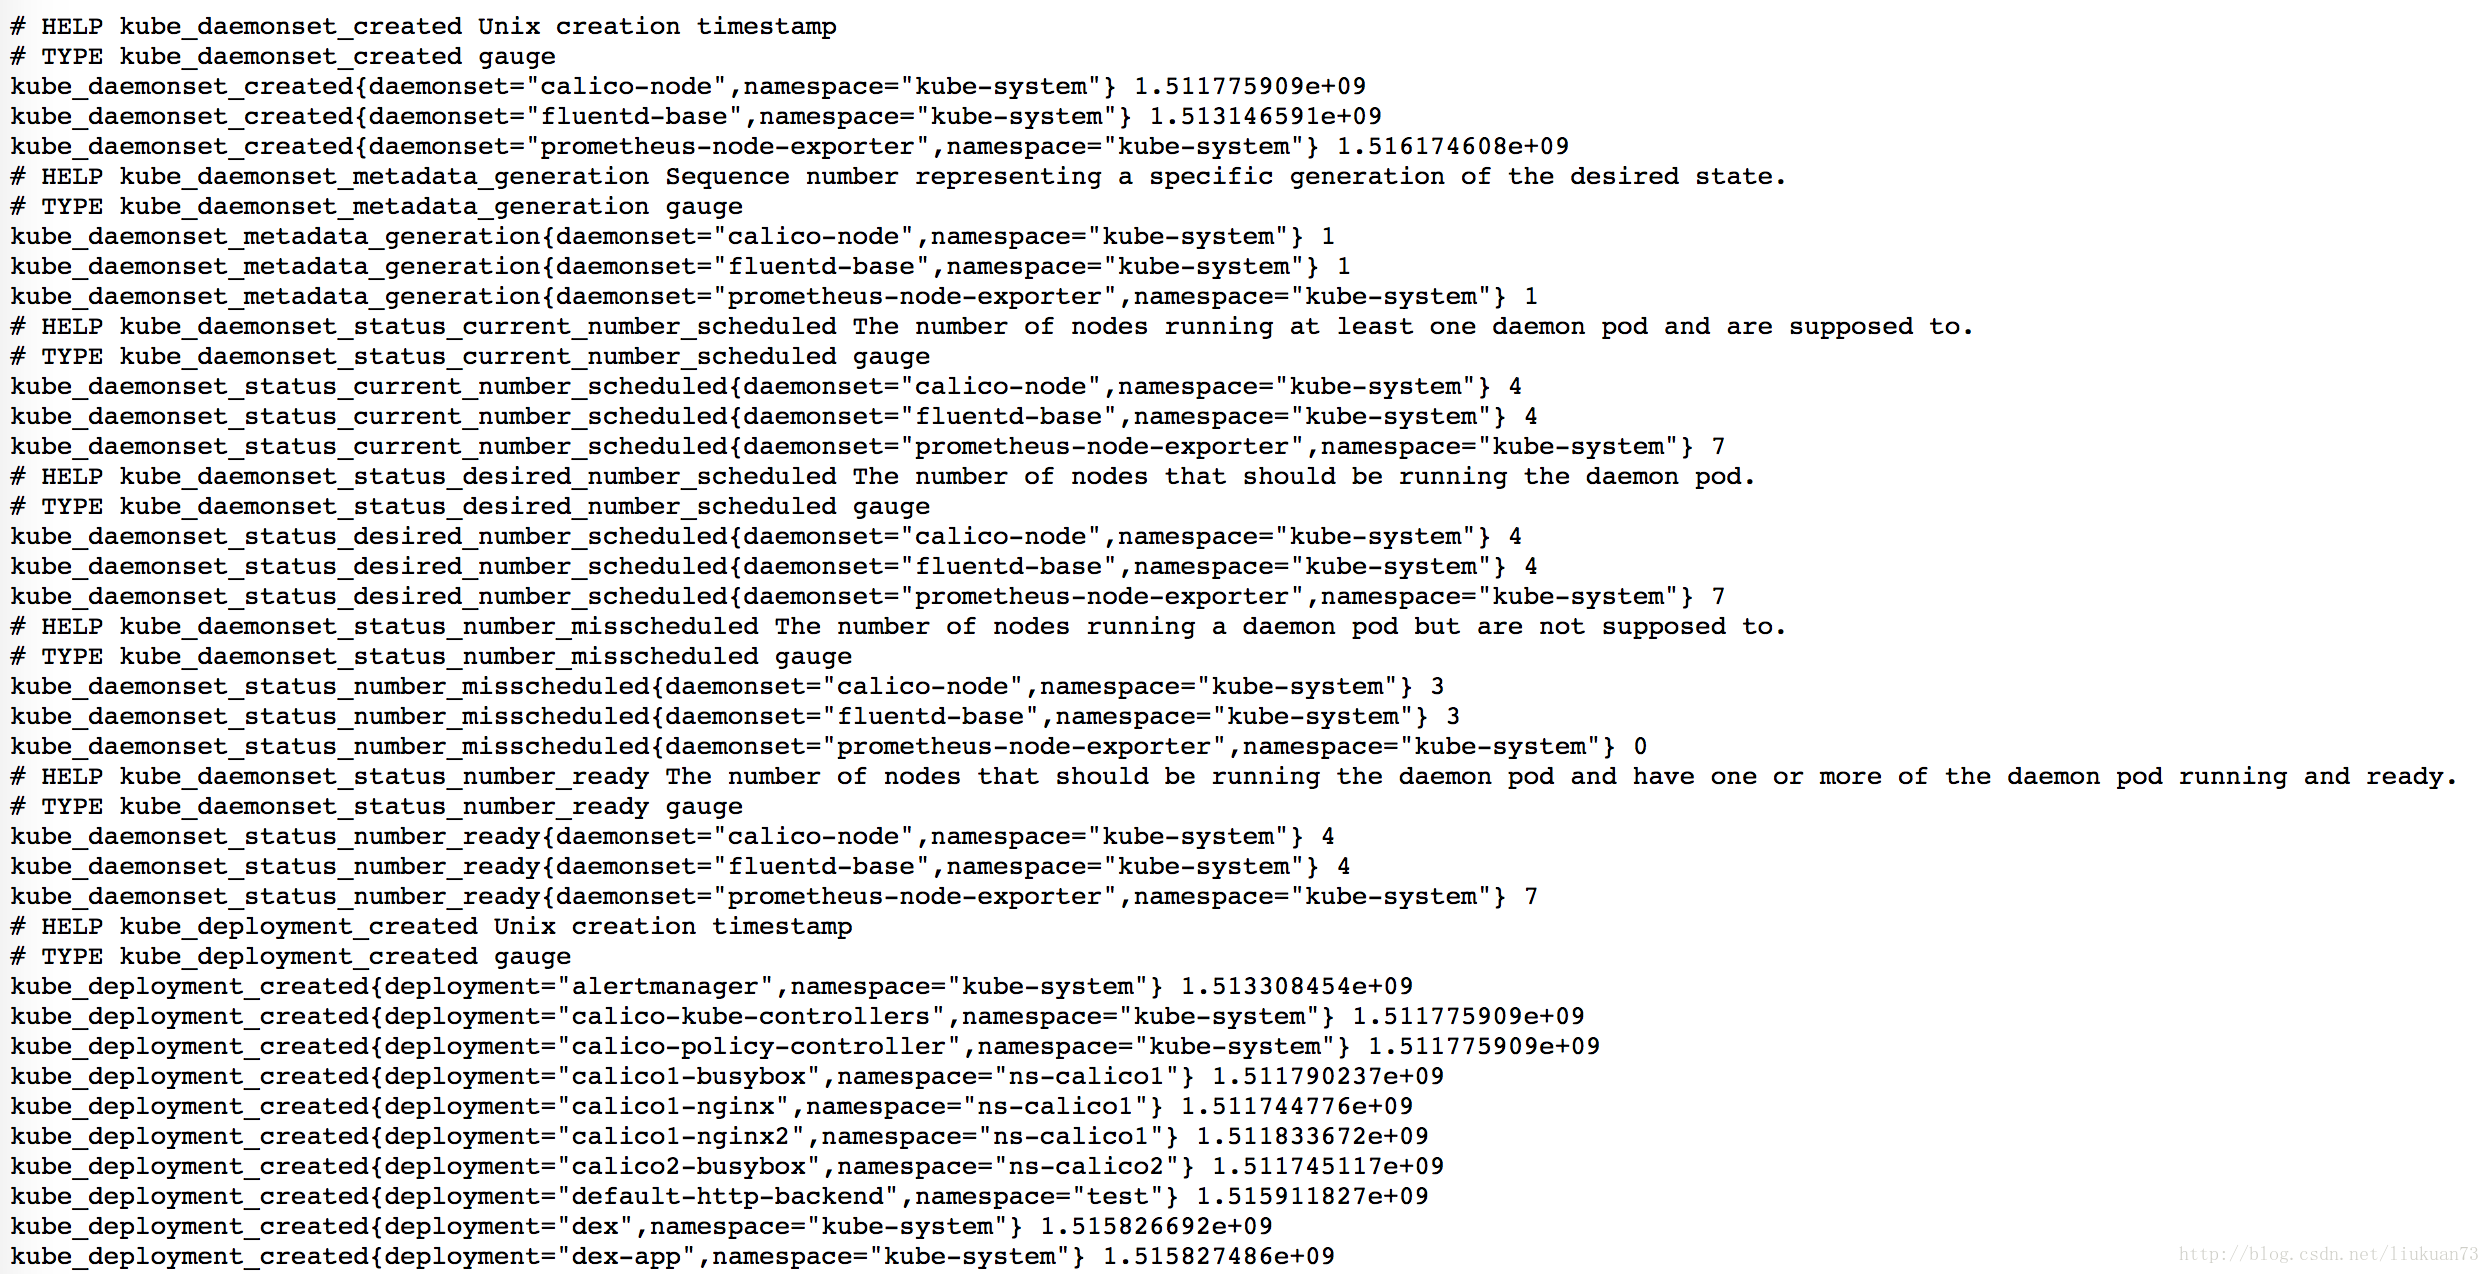
2.3 資源物件的狀態(deployment、pod等)—kube-state-metrics
- 附我的kube-state-metrics-deployment.yaml檔案,包含serviceaccount、deployment、service(https://github.com/liukuan73/k8s-monitor):
apiVersion: v1
kind: ServiceAccount
metadata:
  name: kube-state-metrics
  namespace: kube-system
---
apiVersion: extensions/v1beta1
kind: Deployment
metadata:
  name: kube-state-metrics
  namespace: kube-system
  labels:
    app: kube-state-metrics
spec:
  replicas: 2
  strategy:
    rollingUpdate:
      maxSurge: 1
      maxUnavailable: 1
    type: RollingUpdate
  template:
    metadata:
      labels:
        app: kube-state-metrics
    spec:
      serviceAccountName: kube-state-metrics
      containers:
      - name: kube-state-metrics
        image: gcr.io/google_containers/kube-state-metrics:v1.1.0
        ports:
        - containerPort: 8080
      restartPolicy: Always
---
apiVersion: v1
kind: Service
metadata:
  annotations:
    prometheus.io/scrape: 'true'
  name: kube-state-metrics
  namespace: kube-system
  labels:
    app: kube-state-metrics
spec:
  type: NodePort
  ports:
  - name: kube-state-metrics
    port: 8080
    targetPort: 8080
    nodePort: 30008
  selector:
app: kube-state-metrics- 1
- 2
- 3
- 4
- 5
- 6
- 7
- 8
- 9
- 10
- 11
- 12
- 13
- 14
- 15
- 16
- 17
- 18
- 19
- 20
- 21
- 22
- 23
- 24
- 25
- 26
- 27
- 28
- 29
- 30
- 31
- 32
- 33
- 34
- 35
- 36
- 37
- 38
- 39
- 40
- 41
- 42
- 43
- 44
- 45
- 46
- 47
- 48
- 49
- 50
- 51
備註:
1.在Service中定義標註prometheus.io/scrape: ‘true’,表明該Service需要被promethues發現並採集資料
2.Promethues可以在容器內通過DNS地址 https://kubernetes.default.svc 訪問kubernetes的Rest API.
- 在prometheus的target中可以看到採到資訊(也是在kubernetes-service-endpoints裡):

3. Prometheus部署和配置
前面第二章介紹了k8s平臺的監控資料怎麼採集出來,接下來介紹怎麼用prometheus收集和處理,我的相關啟動和配置檔案請見:https://github.com/liukuan73/k8s-monitor
3.1 prometheus收集資訊源的配置檔案
configmap-prom-config-ssl.yaml
3.2 prometheus告警規則配置檔案
configmap-prom-rule.yaml,這個是prometheus的採集資訊源的配置的相應configmap檔案。
3.2.1 報警規則
報警規則允許你定義基於Prometheus語言表達的報警條件,併發送報警通知到外部服務。
3.2.1.1 定義報警規則
報警規則通過以下格式定義:
ALERT <alert name>
  IF <expression>
  [ FOR <duration> ]
  [ LABELS <label set> ]
[ ANNOTATIONS <label set> ]- 1
- 2
- 3
- 4
- 5
備註:
FOR子句使得Prometheus等待第一個傳進來的向量元素(例如高HTTP錯誤的例項),並計數一個警報。如果元素是active,但是沒有firing的,就處於pending狀態。
LABELS(標籤)子句允許指定一組附加的標籤附到警報上。現有的任何標籤都會被覆蓋,標籤值可以被模板化。
ANNOTATIONS(註釋)子句指定另一組未查明警報例項的標籤,它們被用於儲存更長的其他資訊,例如警報描述或者連結,註釋值可以被模板化。
3.2.1.2 報警規則示例
# Alert for any instance that is unreachable for >5 minutes.
ALERT InstanceDown
  IF up == 0
  FOR 5m
  LABELS { severity = "page" }
  ANNOTATIONS {
    summary = "Instance {{ $labels.instance }} down",
    description = "{{ $labels.instance }} of job {{ $labels.job }} has been down for more than 5 minutes.",
  }

# Alert for any instance that have a median request latency >1s.
ALERT APIHighRequestLatency
  IF api_http_request_latencies_second{quantile="0.5"} > 1
  FOR 1m
  ANNOTATIONS {
    summary = "High request latency on {{ $labels.instance }}",
    description = "{{ $labels.instance }} has a median request latency above 1s (current value: {{ $value }}s)",
}- 1
- 2
- 3
- 4
- 5
- 6
- 7
- 8
- 9
- 10
- 11
- 12
- 13
- 14
- 15
- 16
- 17
- 18
3.3 prometheus啟動檔案
prometheus.yaml是prometheus以deployment起在kubernetes上的配置檔案。
4 告警元件Alertmanager介紹及部署
4.1 overview
Alertmanager與Prometheus是相互分離的兩個部分。Prometheus伺服器根據報警規則將警報傳送給Alertmanager,然後Alertmanager將silencing、inhibition、aggregation等訊息通過電子郵件、PaperDuty和HipChat傳送通知。
設定警報和通知的主要步驟:
- 安裝配置Alertmanager
- 配置Prometheus通過-alertmanager.url標誌與Alertmanager通訊
- 在Prometheus中建立告警規則
4.2 Alertmanager簡介及機制
Alertmanager處理由類似Prometheus伺服器等客戶端發來的警報,之後需要刪除重複、分組,並將它們通過路由傳送到正確的接收器,比如電子郵件、Slack等。Alertmanager還支援沉默和警報抑制的機制。
分組
分組是指當出現問題時,Alertmanager會收到一個單一的通知,而當系統宕機時,很有可能成百上千的警報會同時生成,這種機制在較大的中斷中特別有用。
例如,當數十或數百個服務的例項在執行,網路發生故障時,有可能服務例項的一半不可達資料庫。在告警規則中配置為每一個服務例項都發送警報的話,那麼結果是數百警報被髮送至Alertmanager。
但是作為使用者只想看到單一的報警頁面,同時仍然能夠清楚的看到哪些例項受到影響,因此,人們通過配置Alertmanager將警報分組打包,併發送一個相對看起來緊湊的通知。
分組警報、警報時間,以及接收警報的receiver是在配置檔案中通過路由樹配置的。
抑制
抑制是指當警報發出後,停止重複傳送由此警報引發其他錯誤的警報的機制。
例如,當警報被觸發,通知整個叢集不可達,可以配置Alertmanager忽略由該警報觸發而產生的所有其他警報,這可以防止通知數百或數千與此問題不相關的其他警報。
抑制機制可以通過Alertmanager的配置檔案來配置。
沉默
沉默是一種簡單的特定時間靜音提醒的機制。一種沉默是通過匹配器來配置,就像路由樹一樣。傳入的警報會匹配RE,如果匹配,將不會為此警報傳送通知。
沉默機制可以通過Alertmanager的Web頁面進行配置。
4.3 Alertmanager的配置
Alertmanager通過命令列flag和一個配置檔案進行配置。命令列flag配置不變的系統引數、配置檔案定義禁止規則、通知路由和通知接收器。
要檢視所有可用的命令列flag,執行alertmanager -h。
Alertmanager在執行時載入配置,如果不能很好的形成新的配置,更改將不會被應用,並記錄錯誤。
Alertmanager can reload its configuration at runtime. If the new configuration is not well-formed, the changes will not be applied and an error is logged. A configuration reload is triggered by sending a SIGHUP to the process or sending a HTTP POST request to the /-/reload endpoint.
4.3.1 配置檔案概要介紹
要指定載入的配置檔案,需要使用-config.file標誌(./alertmanager -config.file=simple.yml)。該檔案使用YAML來完成,通過下面的描述來定義。括號內的引數是可選的,對於非列表的引數的值設定為指定的預設值。
<duration>: a duration matching the regular expression [0-9]+(ms|[smhdwy])
<labelname>: a string matching the regular expression [a-zA-Z_][a-zA-Z0-9_]*
<labelvalue>: a string of unicode characters
<filepath>: a valid path in the current working directory
<boolean>: a boolean that can take the values true or false
<string>: a regular string
<secret>: a regular string that is a secret, such as a password
<tmpl_string>: a string which is template-expanded before usage
<tmpl_secret>: a string which is template-expanded before usage that is a secret- 1
- 2
- 3
- 4
- 5
- 6
- 7
- 8
- 9
例子:
global:
  # ResolveTimeout is the time after which an alert is declared resolved
  # if it has not been updated.
  [ resolve_timeout: <duration> | default = 5m ]

  # The default SMTP From header field.
  [ smtp_from: <tmpl_string> ]
  # The default SMTP smarthost used for sending emails.
  [ smtp_smarthost: <string> ]
  # SMTP authentication information.
  [ smtp_auth_username: <string> ]
  [ smtp_auth_password: <secret> ]
  [ smtp_auth_secret: <secret> ]
  [ smtp_auth_identity: <string> ]
  # The default SMTP TLS requirement.
  [ smtp_require_tls: <bool> | default = true ]

  # The API URL to use for Slack notifications.
  [ slack_api_url: <string> ]
  [ victorops_api_key: <string> ]
  [ victorops_api_url: <string> | default = "https://alert.victorops.com/integrations/generic/20131114/alert/" ]
  [ pagerduty_url: <string> | default = "https://events.pagerduty.com/generic/2010-04-15/create_event.json" ]
  [ opsgenie_api_url: <string> | default = "https://api.opsgenie.com/" ]
  [ hipchat_url: <string> | default = "https://api.hipchat.com/" ]
  [ hipchat_auth_token: <secret> ]

# Files from which custom notification template definitions are read.
# The last component may use a wildcard matcher, e.g. 'templates/*.tmpl'.
templates:
  [ - <filepath> ... ]

# The root node of the routing tree.
route: <route>

# A list of notification receivers.
receivers:
  - <receiver> ...

# A list of inhibition rules.
inhibit_rules:
[ - <inhibit_rule> ... ]- 1
- 2
- 3
- 4
- 5
- 6
- 7
- 8
- 9
- 10
- 11
- 12
- 13
- 14
- 15
- 16
- 17
- 18
- 19
- 20
- 21
- 22
- 23
- 24
- 25
- 26
- 27
- 28
- 29
- 30
- 31
- 32
- 33
- 34
- 35
- 36
- 37
- 38
- 39
- 40
- 41
4.3.2 模組詳解
4.3.2.1 路由模組 <route>
路由模組定義了路由樹及其子節點。如果沒有設定的話,子節點的可選配置引數從其父節點繼承。
每個警報進入配置的路由樹的頂級路徑,頂級路徑必須匹配所有警報(即沒有任何形式的匹配)。然後匹配子節點。如果continue的值設定為false,它在匹配第一個孩子後就停止;如果在子節點匹配,continue的值為true,警報將繼續進行後續兄弟姐妹的匹配。如果警報不匹配任何節點的任何子節點(沒有匹配的子節點,或不存在),該警報基於當前節點的配置處理。
路由配置格式
[ receiver: <string> ]
[ group_by: '[' <labelname>, ... ']' ]

# Whether an alert should continue matching subsequent sibling nodes.
[ continue: <boolean> | default = false ]

# A set of equality matchers an alert has to fulfill to match the node.
match:
  [ <labelname>: <labelvalue>, ... ]

# A set of regex-matchers an alert has to fulfill to match the node.
match_re:
  [ <labelname>: <regex>, ... ]

# How long to initially wait to send a notification for a group
# of alerts. Allows to wait for an inhibiting alert to arrive or collect
# more initial alerts for the same group. (Usually ~0s to few minutes.)
[ group_wait: <duration> | default = 30s ]

# How long to wait before sending a notification about new alerts that
# are added to a group of alerts for which an initial notification has
# already been sent. (Usually ~5m or more.)
[ group_interval: <duration> | default = 5m ]

# How long to wait before sending a notification again if it has already
# been sent successfully for an alert. (Usually ~3h or more).
[ repeat_interval: <duration> | default = 4h ]

# Zero or more child routes.
routes:
[ - <route> ... ]- 1
- 2
- 3
- 4
- 5
- 6
- 7
- 8
- 9
- 10
- 11
- 12
- 13
- 14
- 15
- 16
- 17
- 18
- 19
- 20
- 21
- 22
- 23
- 24
- 25
- 26
- 27
- 28
- 29
- 30
- 31
示例:
# The root route with all parameters, which are inherited by the child
# routes if they are not overwritten.
route:
  receiver: 'default-receiver'
  group_wait: 30s
  group_interval: 5m
  repeat_interval: 4h
  group_by: [cluster, alertname]
  # All alerts that do not match the following child routes
  # will remain at the root node and be dispatched to 'default-receiver'.
  routes:
  # All alerts with service=mysql or service=cassandra
  # are dispatched to the database pager.
  - receiver: 'database-pager'
    group_wait: 10s
    match_re:
      service: mysql|cassandra
  # All alerts with the team=frontend label match this sub-route.
  # They are grouped by product and environment rather than cluster
  # and alertname.
  - receiver: 'frontend-pager'
    group_by: [product, environment]
    match:
team: frontend- 1
- 2
- 3
- 4
- 5
- 6
- 7
- 8
- 9
- 10
- 11
- 12
- 13
- 14
- 15
- 16
- 17
- 18
- 19
- 20
- 21
- 22
- 23
- 24
4.3.2.2 抑制規則模組 <inhibit_rule>
抑制規則,是存在另一組匹配器匹配的情況下,靜音其他被引發警報的規則。這兩個警報,必須有一組相同的標籤。
抑制配置格式
# Matchers that have to be fulfilled in the alerts to be muted.
target_match:
  [ <labelname>: <labelvalue>, ... ]
target_match_re:
  [ <labelname>: <regex>, ... ]

# Matchers for which one or more alerts have to exist for the
# inhibition to take effect.
source_match:
  [ <labelname>: <labelvalue>, ... ]
source_match_re:
  [ <labelname>: <regex>, ... ]

# Labels that must have an equal value in the source and target
# alert for the inhibition to take effect.
[ equal: '[' <labelname>, ... ']' ]- 1
- 2
- 3
- 4
- 5
- 6
- 7
- 8
- 9
- 10
- 11
- 12
- 13
- 14
- 15
- 16
4.3.2.3 接收器 <receiver>
顧名思義,警報接收的配置。
通用配置格式:
# The unique name of the receiver.
name: <string>

# Configurations for several notification integrations.
email_configs:
  [ - <email_config>, ... ]
hipchat_configs:
  [ - <hipchat_config>, ... ]
pagerduty_configs:
  [ - <pagerduty_config>, ... ]
pushover_configs:
  [ - <pushover_config>, ... ]
slack_configs:
  [ - <slack_config>, ... ]
opsgenie_configs:
  [ - <opsgenie_config>, ... ]
webhook_configs:
  [ - <webhook_config>, ... ]
victorops_configs:
[ - <victorops_config>, ... ]- 1
- 2
- 3
- 4
- 5
- 6
- 7
- 8
- 9
- 10
- 11
- 12
- 13
- 14
- 15
- 16
- 17
- 18
- 19
- 20
Alertmanager會使用以下的格式向配置端點發送HTTP POST請求:
{
  "version": "4",
  "groupKey": <string>,    // key identifying the group of alerts (e.g. to deduplicate)
  "status": "<resolved|firing>",
  "receiver": <string>,
  "groupLabels": <object>,
  "commonLabels": <object>,
  "commonAnnotations": <object>,
  "externalURL": <string>,  // backlink to the Alertmanager.
  "alerts": [
    {
      "labels": <object>,
      "annotations": <object>,
      "startsAt": "<rfc3339>",
      "endsAt": "<rfc3339>"
    },
    ...
  ]
}- 1
- 2
- 3
- 4
- 5
- 6
- 7
- 8
-
相關推薦
kubernetes監控告警詳解
1. 概述1.1 總體目標從監控平臺本身的業務需求分析來看,我們至少應該希望通過Prometheus平臺獲取到以下監控資料:效能指標 1.容器相關的效能指標資料(如:cpu, memory, filesystem) 2.Pod相關的效能指標資料 3.主機節點相關的效能指標資料服務健康狀態 1.Deployme
原生Kubernetes監控功能詳解-Part1
Kubernetes是一個開源的容器編排框架,它為我們提供了一種簡單的部署、擴充套件和監控的方法。本文將討論Kubernetes的
kubernetes之StatefulSet詳解
part 更新 實現 ati partition code 自動創建 svc 解決 概述 RC、Deployment、DaemonSetStatefulSet都是面向無狀態的服務,它們所管理的Pod的IP、名字,啟停順序等都是隨機的,而StatefulSet是什麽?顧名思義
JVM監控命令詳解(轉)
JVM監控命令基本就是 jps、jstack、jmap、jhat、jstat 幾個命令的使用就可以了 JDK本身提供了很多方便的JVM效能調優監控工具,除了整合式的VisualVM和jConsole外,還有jps、jstack、jmap、jhat、jstat
JVM監控工具詳解
企業級應用開發中經常會遇到以下問題,可以使用工具對JVM進行監管,以便及時查詢問題所在。 記憶體不足OutOfMemory(大物件沒有gc等),記憶體洩露; 執行緒死鎖,執行緒數過多; 鎖爭用(Lock Contention),資源未及時釋放(資料庫); Java程序CPU消耗過高.
linux系列之常用監控命令詳解
1.top命令 優點:實時掌握OS整體資訊,每隔幾秒鐘會顯示一下OS的資訊,並整理出活躍的程序,顯示這些程序的資訊。 缺點:在實時顯示資訊的情況下,我們不能知道非活躍程序的資訊,如果需要知道非活躍程序,就得用ps命令。 ***load average平均負載:1分
Linux效能監控命令詳解:lsof
lsof可以檢視當前系統所有的開啟檔案,在linux環境下,一切皆檔案,通過檔案不僅僅可以訪問常規資料,還可以訪問網路連線和硬體,如傳輸控制協議 (TCP) 和使用者資料報協議 (UDP) 套接字等,系統在後臺都為該應用程式分配了一個檔案描述符,檔案描述符提供了大量關於這個
Linux效能監控命令詳解:free
在系統遇到各種IO瓶頸,記憶體使用率高,cpu使用率高等問題時,我們如何來定位錯誤?linux提供了很多命令來協助我們快速定位到錯誤,free命令是Linux最常用的命令之一:它可以檢視系統的記憶體狀況,包括伺服器的總記憶體,已經使用的記憶體和剩下未被使用的記憶體,以及緩衝區和快取各自佔用的
LR監控Linux系統伺服器效能監控指標詳解
一、常用監控指標: 從LR-System Resource Graphs裡面右鍵add measurement,填寫linux機器的IP, 出現所有unix/linux的計數器,包括cpu的,mem的,disk,network的。 幾個常用的監控指標: aver
Linux zabbix最新2.4.3版本監控搭建詳解
一、zabbix簡介(摘自百度百科) zabbix是一個基於WEB介面的提供分散式系統監視以及網路監視功能的企業級的開源解決方案。 zabbix能監視各種網路引數,保證伺服器系統的安全運營;並提供柔軟的通知機制以讓系統管理員快速定位/解決存在的各種問題。zabbix由2部分構成,zabbix ser
Kubernetes的Configmap詳解
ConfigMap是用來儲存配置檔案的kubernetes資源物件,所有的配置內容都儲存在etcd中。 1.建立ConfigMap 建立ConfigMap的方式有4種: 通過直接在命令列中指定configmap引數建立,即--from-literal
MongoDB多緯度監控方法詳解
狀態 com 檢測 write ces 機器 查找 隊列 lob 一、mongostat工具方法mongostat是mongdb自帶的狀態檢測工具,在命令行下使用。它會間隔固定時間獲取mongodb的當前運行狀態,並輸出。如果你發現數據庫突然變慢或者有其他問題的話,你第一手
JVM監控命令詳解
想要了解更多,加QQ群72132378 JDK本身提供了很多方便的JVM效能調優監控工具,除了整合式的VisualVM和jConsole外,還有jps、jstack、jmap、jhat、jstat等小巧的工具,本部落格希望能起拋磚引玉之用,讓大家能開始對JVM效能調
資深實踐篇 |基於Kubernetes 1.61的Kubernetes Scheduler排程詳解
資深實踐篇 |基於Kubernetes 1.61的Kubernetes Scheduler排程詳解 關鍵字標籤:騰訊雲,效能優化,Github 說明:該文轉載自騰訊雲技術社群騰雲閣,已徵求作者本人同意。 原始碼為 k8s v1.6.1 版本,github 上對應的 com
Zabbix監控流程詳解(自己的心得)
本篇主要是我最近使用zabbix3.2的一些理解,參考官方文件https://www.zabbix.com/documentation/3.2/manual 先拋開zabbix監控的其他架構不談,從最簡單的server-agent模式說起,即監控主機-被監控主機(主動模式
kubernetes容器啟動詳解
如果大家對kubernetes元件以及架構相關分析,可以看我之前的原始碼閱讀,今天只從一個函式分析容器的啟動過程,這個函式就是SyncPod,這個是建立kubelet裡面最核心的一個函數了。這個方法分為五步: // 1. Compute sandbox
RDS-SQL SERVER使用者控制檯監控資訊詳解
RDS-SQL SERVER使用者控制檯監控資訊詳解 一. 工具 Microsoft SQL Server 2008R2 提供了一些工具來監控資料庫。方法之一是動態管理檢視。動態管理檢視 (DMV)返回的伺服器狀態資訊可用於監控伺服器例項的執行狀況、診斷問題和優化效能。
kubernetes cni網路詳解
1.CNI介紹 一直以來,kubernetes 並沒有專門的網路模組負責網路配置,它需要使用者在主機上已經配置好網路。 kubernetes 對網路的要求是: 容器之間(包括同一臺主機上的容器,和不同主機的容器)可以互相通訊 容器和叢集中所有的節點也能直
超長幹貨 | Kubernetes命名空間詳解
模板 true ext 邏輯 時間 ont 集群 組織 了解 K8s使用命名空間的概念幫助解決集群中在管理對象時的復雜性問題。在本文中,會討論命名空間的工作原理,介紹常用實例,並分享如何使用命名空間來管理K8s對象。最後,介紹名為projects的Rancher特性是如何構
Kubernetes Pod 驅逐詳解
原文連結:Kubernetes Pod 驅逐詳解 在 Kubernetes 中,Pod 使用的資源最重要的是 CPU、記憶體和磁碟 IO,這些資源可以被分為可壓縮資源(CPU)和不可壓縮資源(記憶體,磁碟 IO)。可壓縮資源不可能導致 Pod 被驅逐,因為當 Pod 的 CPU 使用量很多時,系統可以通過