使用HTML的canvas,給表格畫斜線
阿新 • • 發佈:2019-02-16
使用HTML的canvas,給表格中畫斜線
<!DOCTYPE html>
<html>
<head>
	<meta charset="utf-8" />
	<title>給表格加斜線</title>
</head>
<style>
table,td{
	border:2px solid black;
	border-collapse:collapse;
}
#header{
	width:80px;
	height:40px;
}
</style>
<script>
function line(header,line_width,line_color,line_number){
	var table = document.getElementById(header);
	var xpos = table.clientWidth;
	var ypos = table.clientHeight;
	var canvas = document.getElementById('line');
	if(canvas.getContext){
		var ctx = canvas.getContext('2d');
		ctx.clearRect(0,0,xpos,ypos); //清空畫布,多個表格時使用
		ctx.fill();
		ctx.lineWidth = line_width;
		ctx.strokeStyle = line_color;
		ctx.beginPath();
		switch(line_number){
			case 1:
				ctx.moveTo(0,0);
				ctx.lineTo(xpos,ypos);
				break;
			case 2:
				ctx.moveTo(0,0);
				ctx.lineTo(xpos/2,ypos);
				ctx.moveTo(0,0);
				ctx.lineTo(xpos,ypos/2);
				break;
			case 3:
				ctx.moveTo(0,0);
				ctx.lineTo(xpos,ypos);
				ctx.moveTo(0,0);
				ctx.lineTo(xpos/2,ypos);
				ctx.moveTo(0,0);
				ctx.lineTo(xpos,ypos/2);
				break;
			default:
			return 0;
		}

		ctx.stroke();
		ctx.closePath();
		document.getElementById(header).style.backgroundImage = 'url("' + ctx.canvas.toDataURL() + '")';
		document.getElementById(header).style.background-attachment= 'fixed';
	}
}
window.onload = function (){
	line('header',2,'black',3);
	//目標單元格,線的寬度,線的顏色,線的條數,1~3,
	//line('two',2,'black',2);
}
window.onresize = function(){		//當視窗改變時,也隨之改變
//可以加上檢測 寬度高度是否變化在執行函式
	line('header',2,'black',3);
}
</script>
<body >
	<canvas id="line" style="display:none;"></canvas>
	<table>
		<tr>
			<td id="header" colspan='2' rowspan='2' >
				<span style="float:right">內容</span><br/><div style="float:left;">姓名</div>
			</td>
			<td>asd</td>
			<td>asd</td>
			<td>asd</td>
			<td>asd</td>
		</tr>
		<tr>

			<td>asd</td>
			<td>asd</td>
			<td>asd</td>
			<td>asd</td>
		</tr>
		<tr>
			<td >表頭</td>
			<td>asd</td>
			<td>asd</td>
			<td>asd</td>
			<td>asd</td>
			<td>asd</td>
		</tr>
	</table>
</body>
</html>
window.onload = line();這樣不能傳遞引數
<body onload="line('header',2,'black',1)"></body>或者
window.onload = function (){
line('header',2,'black',1);
//其它函式
}
效果圖
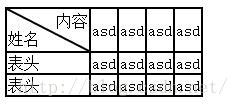
一條斜線
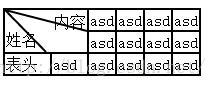
兩條斜線
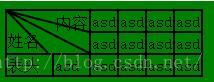
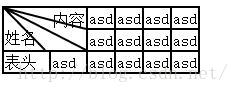
三條斜線
加背景顏色