使用GNUPLOT畫出好看的資料曲線
阿新 • • 發佈:2019-02-18
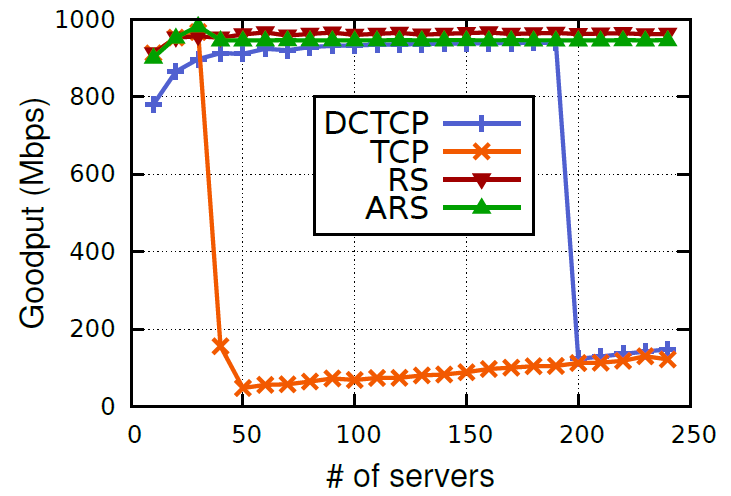
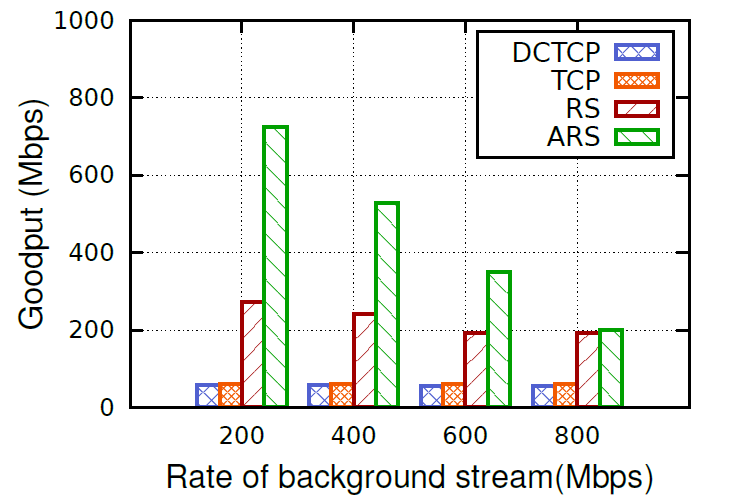
下面這兩張是我用gnuplot畫的兩個資料圖,第一個圖是曲線圖,表示不同協議吞吐量的一個對比。第二個圖橫向對比的柱狀圖。個人覺得還是滿精美的。本人也是從PDQ這篇論文的一個作者的主要上看到的這個畫圖方法,並做了一些改進。下面直接將畫圖的將本放出來。GNUPLOT指令碼我也不作解釋了,因為我也只是會用而已。主要是利用了cairo-pdf這個庫。
第一個圖的指令碼:這個指令碼輸出的是pdf檔案,如果要輸出png,則要將set term pdfcairo的改成set term pngcairo。
# Note you need gnuplot 4.4 for the pdfcairo terminal.

set term pdfcairo enhanced mono font "/usr/share/fonts/simsun.ttc,18" linewidth 2 size 640,480

# Line style for axes
set style line 80 lt rgb "#000000" lw 5
#:set size 0.75,1
# Line style for grid
set style line 81 lt 0  # dashed
set style line 81 lt rgb "#000000"  # grey

set grid back linestyle 81
#set border 3 back linestyle 80 # Remove border on top and right.  These
             # borders are useless and make it harder
             # to see plotted lines near the border.
    # Also, put it in grey; no need for so much emphasis on a border.
#set xtics 333.0
#set ytics nomirror

#set log x 2
#set mxtics 2    # Makes logscale look good.
set ytics 200
# Line styles: try to pick pleasing colors, rather
# than strictly primary colors or hard-to-see colors
# like gnuplot's default yellow.  Make the lines thick
# so they're easy to see in small plots in papers.
#mono line
set style line 1 lt rgb "#1C1C1C" lw 1 pt 9 pointsize 2
set style line 2 lt rgb "#363636" lw 1 pt 11 pointsize 2
set style line 3 lt rgb "#4F4F4F" lw 1 pt 1 pointsize 2
set style line 4 lt rgb "#696969" lw 1 pt 2 pointsize 2
#set style line 1 lt rgb "#00A000" lw 2 pt 9 pointsize 1
#set style line 2 lt rgb "#A00000" lw 2 pt 11 pointsize 1
#set style line 3 lt rgb "#5060D0" lw 2 pt 1 pointsize 1
#set style line 4 lt rgb "#F25900" lw 2 pt 2 pointsize 1
set style line 5 lt rgb "#A00000" lw 1 pt 8 pointsize 0.5
set style line 6 lt rgb "#00A000" lw 1 pt 2 pointsize 0.5
set style line 7 lt rgb "#5060D0" lw 1 pt 4 pointsize 0.5
set style line 8 lt rgb "#F25900" lw 1 pt 6 pointsize 0.5


set output "16.pdf"
set xlabel "伺服器數量" font ",20"
set ylabel "應用層吞吐量 (Mbps)" font ",20" offset 1.5,0,0
#set key horizontal samplen 2.5 bot center out
#set key box linestyle 1  samplen 1 spacing 1 horizontal
#set key box linestyle 1 inside center center Left reverse samplen 2 spacing 1 horizontal font "Arial,18" width 0.95 nobox
set key at 180,800 font ",20" height 0.9 width 0.5 spacing 1
set key box

set xrange [0:250]
set yrange [0:1000]

plot "DC16" u 1:2 title "  DCTCP" w lp ls 3,"TCP16" u 1:2 t "TCP" w lp ls 4,"RS16" u 1:2 title "RS" w lp ls 2,"ARS16" u 1:2 title "ARS" w lp ls 1
第二個圖的指令碼:
set term pdfcairo font ",20" linewidth 2 fontscale 1.0 size 800,600
# Line style for axes
set style line 80 lt rgb "#000000"

#:set size 0.75,1
# Line style for grid
set style line 81 lt 0  # dashed
set style line 81 lt rgb "#000000"  # grey

set grid back linestyle 81
#set border 3 back linestyle 80 # Remove border on top and right.  These
             # borders are useless and make it harder
             # to see plotted lines near the border.
    # Also, put it in grey; no need for so much emphasis on a border.
#set xtics 333.0
#set ytics nomirror

#set log x 2
#set mxtics 2    # Makes logscale look good.

# Line styles: try to pick pleasing colors, rather
# than strictly primary colors or hard-to-see colors
# like gnuplot's default yellow.  Make the lines thick
# so they're easy to see in small plots in papers.


set style line 1 lt rgb "#1C1C1C" lw 1 pt 9 pointsize 2
set style line 2 lt rgb "#363636" lw 1 pt 11 pointsize 2
set style line 3 lt rgb "#4F4F4F" lw 1 pt 1 pointsize 2
set style line 4 lt rgb "#696969" lw 1 pt 2 pointsize 2


#set style line 1 lt rgb "#A00000" lw 1 pt 7 pointsize 0.5
#set style line 2 lt rgb "#00A000" lw 1 pt 9 pointsize 0.5
#set style line 3 lt rgb "#5060D0" lw 1 pt 5 pointsize 0.5
#set style line 4 lt rgb "#F25900" lw 1 pt 13 pointsize 0.5
set style line 5 lt rgb "#A00000" lw 1 pt 8 pointsize 0.5
set style line 6 lt rgb "#00A000" lw 1 pt 2 pointsize 0.5
set style line 7 lt rgb "#5060D0" lw 1 pt 4 pointsize 0.5
set style line 8 lt rgb "#F25900" lw 1 pt 6 pointsize 0.5

set style fill pattern 1 border
set style histogram clustered gap 1 title offset character 0, 0, 0
set style data histograms

set output "bg16.pdf"

set xlabel "背景流速率(Mbps)" font "Helvetica,20"
set ylabel "應用層吞吐量 (Mbps)" font "Helvetica,20" offset 1.5,0,0
#set key samplen 2 width 2 box 4 top right
set key samplen 2  font ",20" top right box width 2 height 0.5 spacing 1


#set key at 0.5,0.5
#set key 0.01,100

#set xrange [0:1000]
set yrange [0:1000]

plot '1.dat.16' using 5:xtic(1) ti col lw 1.5 lc rgb "#1C1C1C" fill pattern 1 ,'' u 4 ti col lw 1.5 lc rgb "#363636" fill pattern 2,'' u 3 ti col lw 1.5 lc rgb "#4F4F4F" fill pattern 5,'' u 2 ti col lw 1.5 lc rgb "#696969" fill pattern 4
#第一個using要倒過來寫。


