
Grafana+prometheus監控體系實踐
1.1、grafana介紹
Grafana是一個開源指標分析和可視化套件,常用於可視化基礎設施的性能數據和應用程序分析的時間序列數據。也可以應用於其他領域,包括工業傳感器,家庭自動化,天氣和過程控制。但請註意,我們使用Grafana最關心的是如何把數據進行聚合後進行展示。
Grafana支持多種不同的時序數據庫數據源,Grafana對每種數據源提供不同的查詢方法,而且能很好的支持每種數據源的特性。它支持下面幾種數據源:Graphite、Elasticsearch、CloudWatch、InfluxDB、OpenTSDB、Prometheus、MySQL、Postgres、Microsoft SQL Server (MSSQL)。每種數據源都有相應的文檔,可以將多個數據源的數據合並到一個單獨的儀表板上。
1.2、Prometheus介紹
Prometheus是一個開源監控系統,集數據采集、存儲與展示為一體,功能十分強大,官網架構圖如下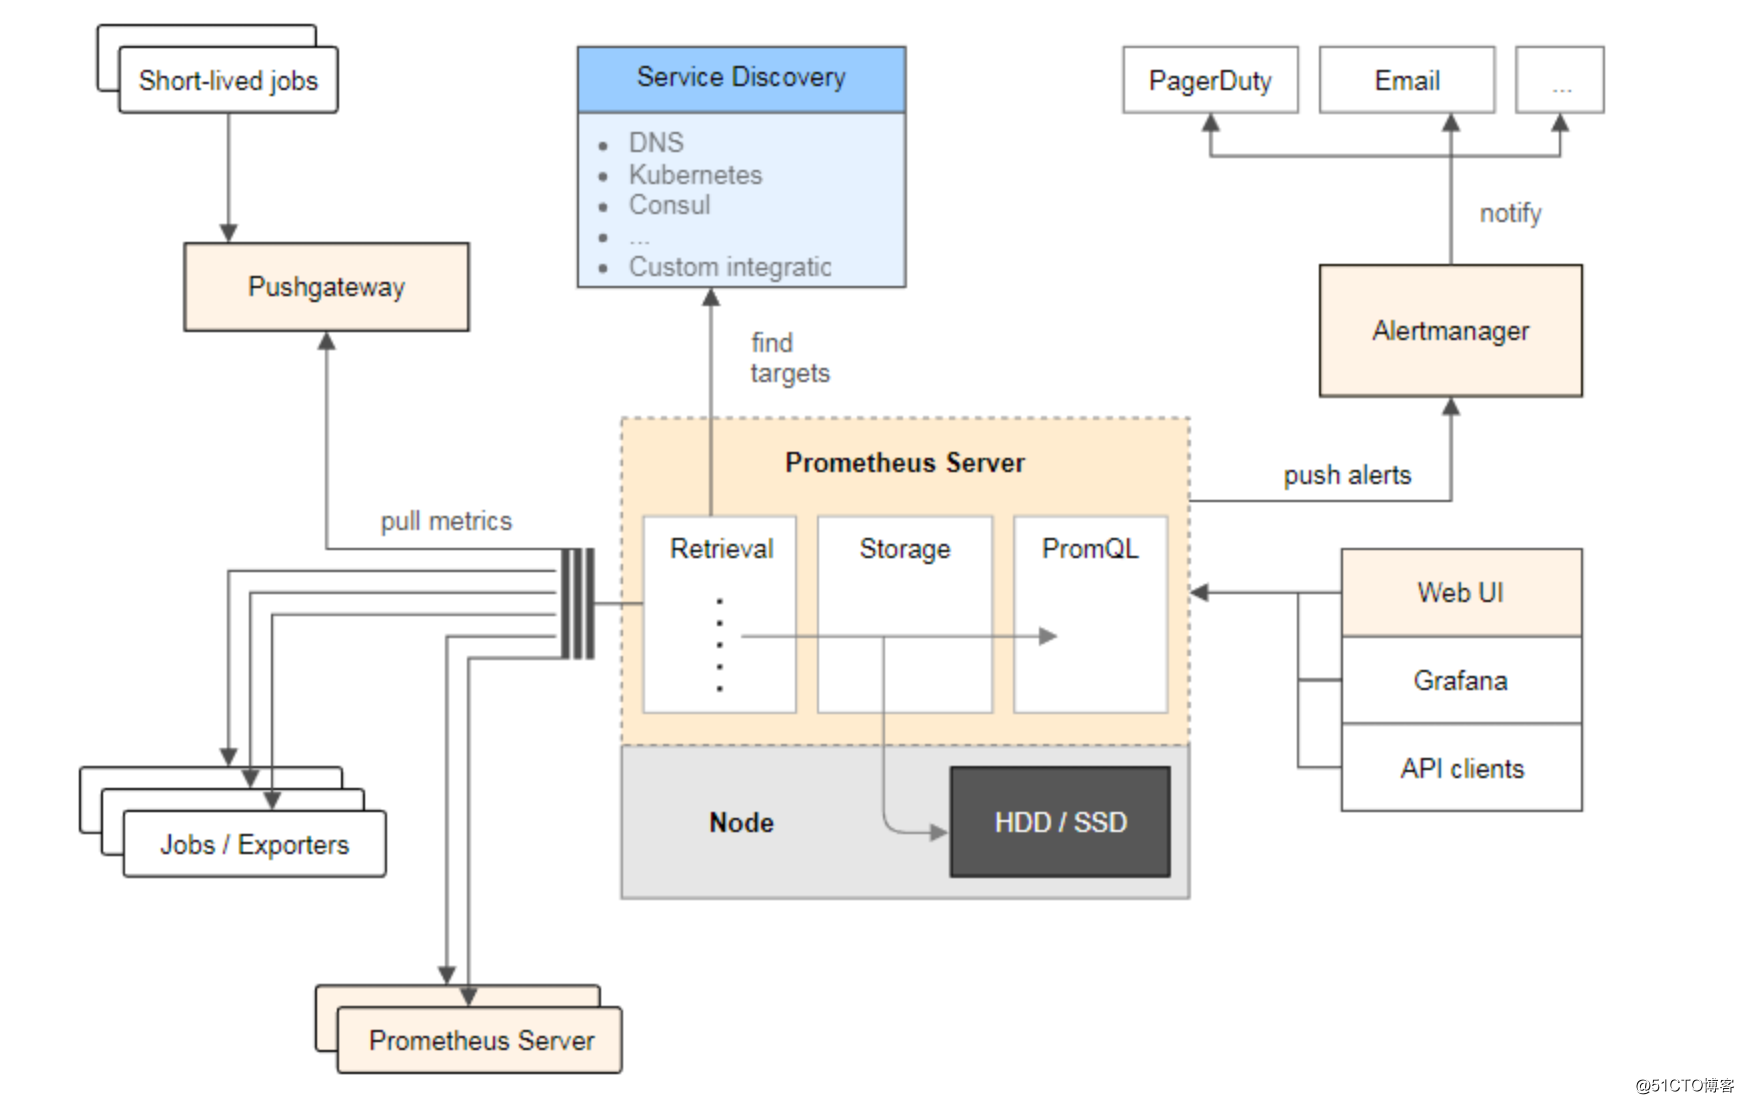
架構圖中各模塊功能解析:
Prometheus Server:Prometheus Sever是Prometheus組件中的核心部分,負責實現對監控數據的獲取,存儲及查詢
Exporters:Exporter將監控數據采集的端點通過HTTP服務的形式暴露給Prometheus Server,Prometheus Server通過訪問該Exporter提供的Endpoint端點,即可以獲取到需要采集的監控數據
Alertmanager:實現prometheus的告警功能
PushGateway:Prometheus數據采集基於Prometheus Server從Exporter pull數據,因此當網絡環境不允許Prometheus Server和Exporter進行通信時,可以使用PushGateway來進行中轉。通過PushGateway將內部網絡的監控數據主動Push到Gateway中,Prometheus Server采用針對Exporter同樣的方式,將監控數據從PushGateway pull到Prometheus Server。
1.3、監控流程
Prometheus從exporters中收取數據並入庫,grafana從prometheus中提取數據圖表展示
1.4、準備工作
節點:
Node1:192.168.143.130 Prometheus server & grafana
Node2:192.168.143.131 node_exporter
軟件版本:
Granafa 5.3.2
Prometheus 2.5.0
二、部署Grafana+prometheus
2.1、安裝Grafana+prometheus(server)
Node1:
rpm -ivh grafana-5.3.2-1.x86_64.rpm
tar xzf  prometheus-2.5.0.tar.gz -C /usr/local/
2.2、編輯prometheus配置文件,加入被監控主機node2
vim prometheus.yml
scrape_configs:
  - job_name: ‘node2_sys‘
    static_configs:
    - targets: [‘192.168.143.131:9100‘]
2.3、添加用戶
groupadd prometheus
useradd -g prometheus -s /sbin/nologin prometheus
chown -R prometheus:prometheus /usr/local/prometheus-2.5.0/
2.4、啟動腳本
vim start.sh
#!/bin/bash
#
./prometheus --config.file=prometheus.yml >>Prometheus.log &>/dev/null &
2.5、啟動Grafana+prometheus
prometheus:./start.sh
Grafana:systemctl start grafana-server.service
三、部署node_exporter
3.1、安裝node_exporter(client)
Node2:
tar xzf node_exporter.tar.gz -C /usr/local/
3.2、添加用戶
groupadd prometheus
useradd -g prometheus -s /sbin/nologin prometheus
chown -R prometheus:prometheus /usr/local/node_exporter/
3.3、添加開機啟動
vim /usr/lib/systemd/system/node_exporter.service
[Unit]
Description=Prometheus
Documentation=https://prometheus.io/
After=network.target
[Service]
Type=simple
User=prometheus
ExecStart=/usr/local/node_exporter/node_exporter --web.listen-address=:9100 --collector.textfile.directory=/usr/local/node_exporter
Restart=on-failure
[Install]
WantedBy=multi-user.target
3.4、啟動node_exporter
systemctl start node_exporter.service
systemctl enable node_exporter.service
四、grafana界面設置
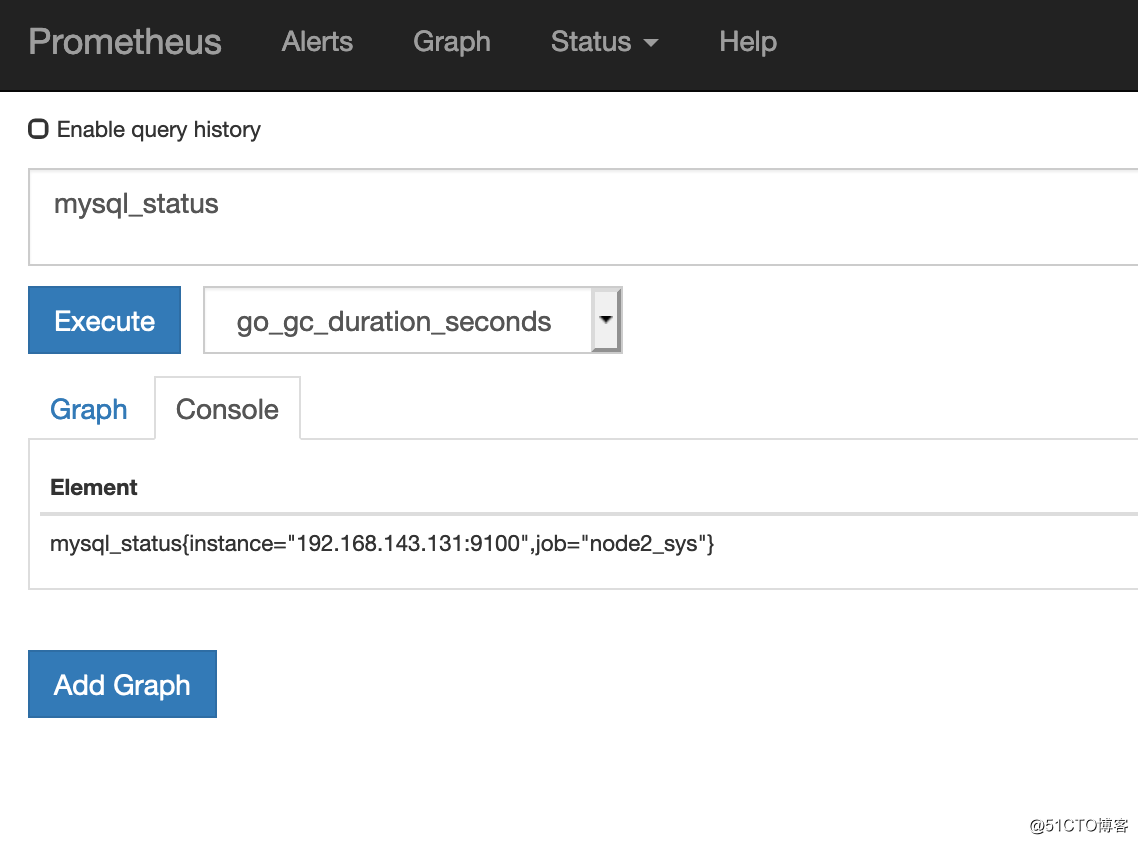
4.1、prometheus-ui查看監控數據
url:http://192.168.143.130:9090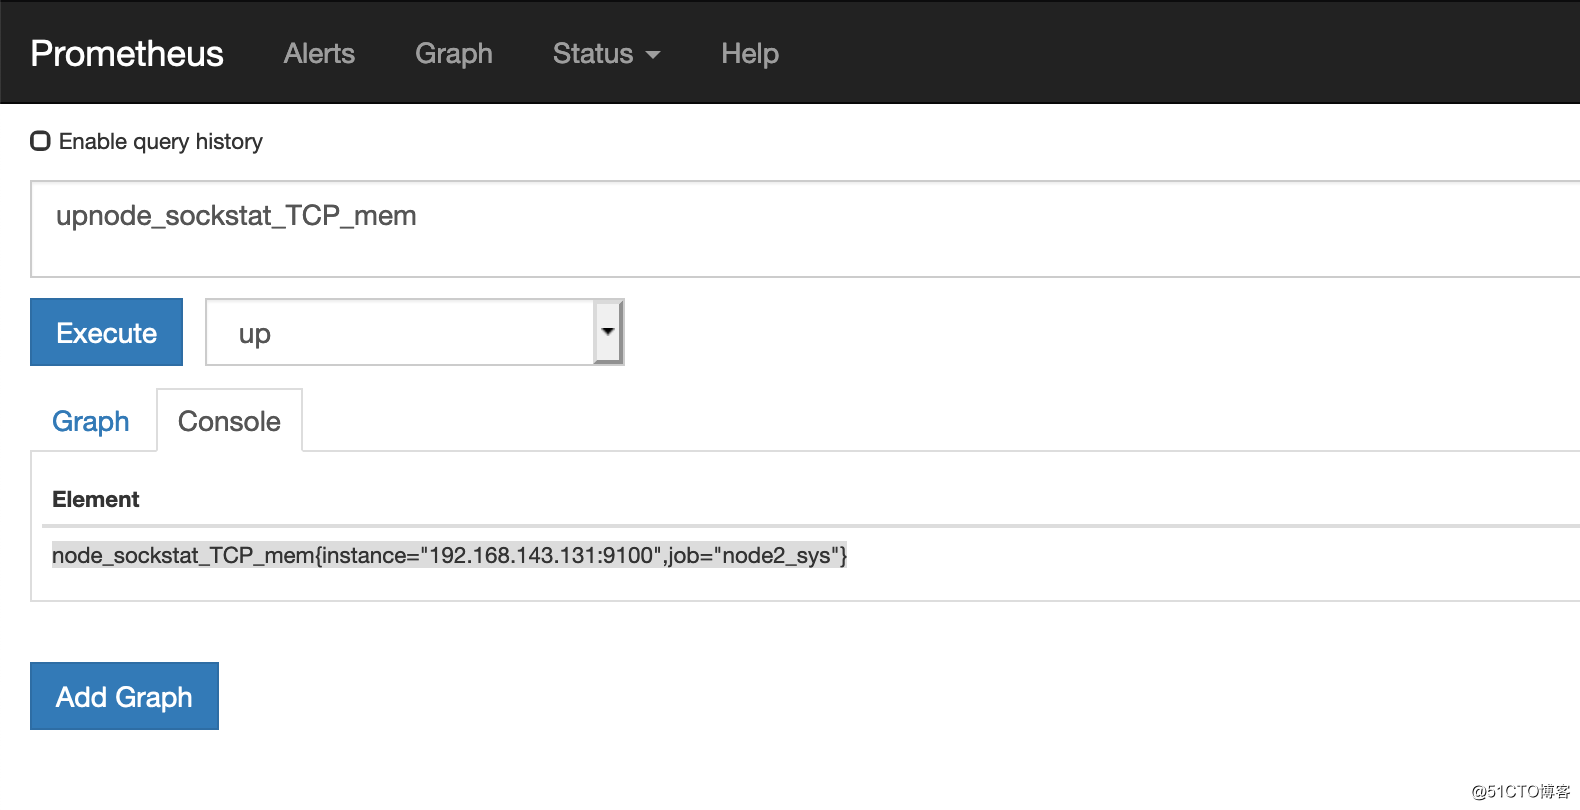
根據輸入的key找到你要監控的數據,Element下面的是向grafana上添加的公式
4.2、grafana添加數據源
url: http://192.168.143.130:3000
默認用戶名密碼admin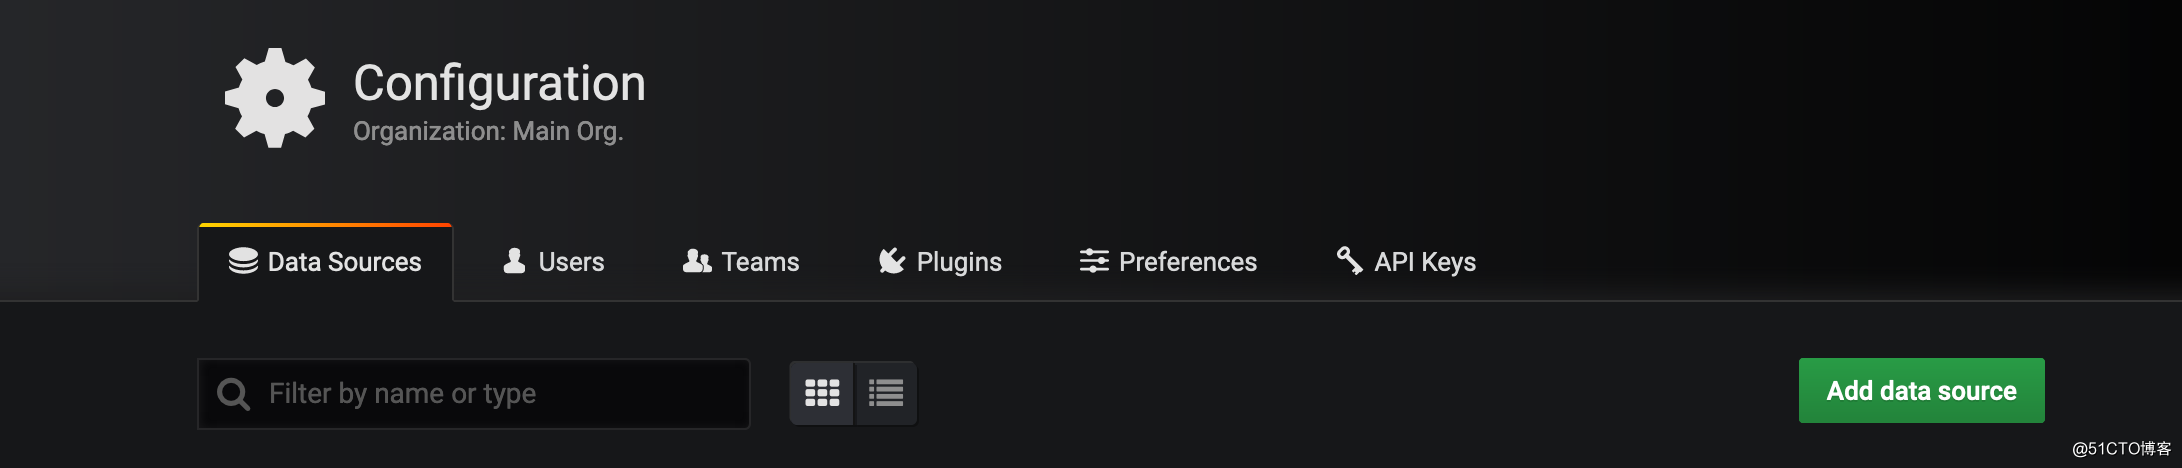
添加DataSource,type中選擇prometheus,url中輸入prometheus地址,name中輸入該DataSource名稱,保存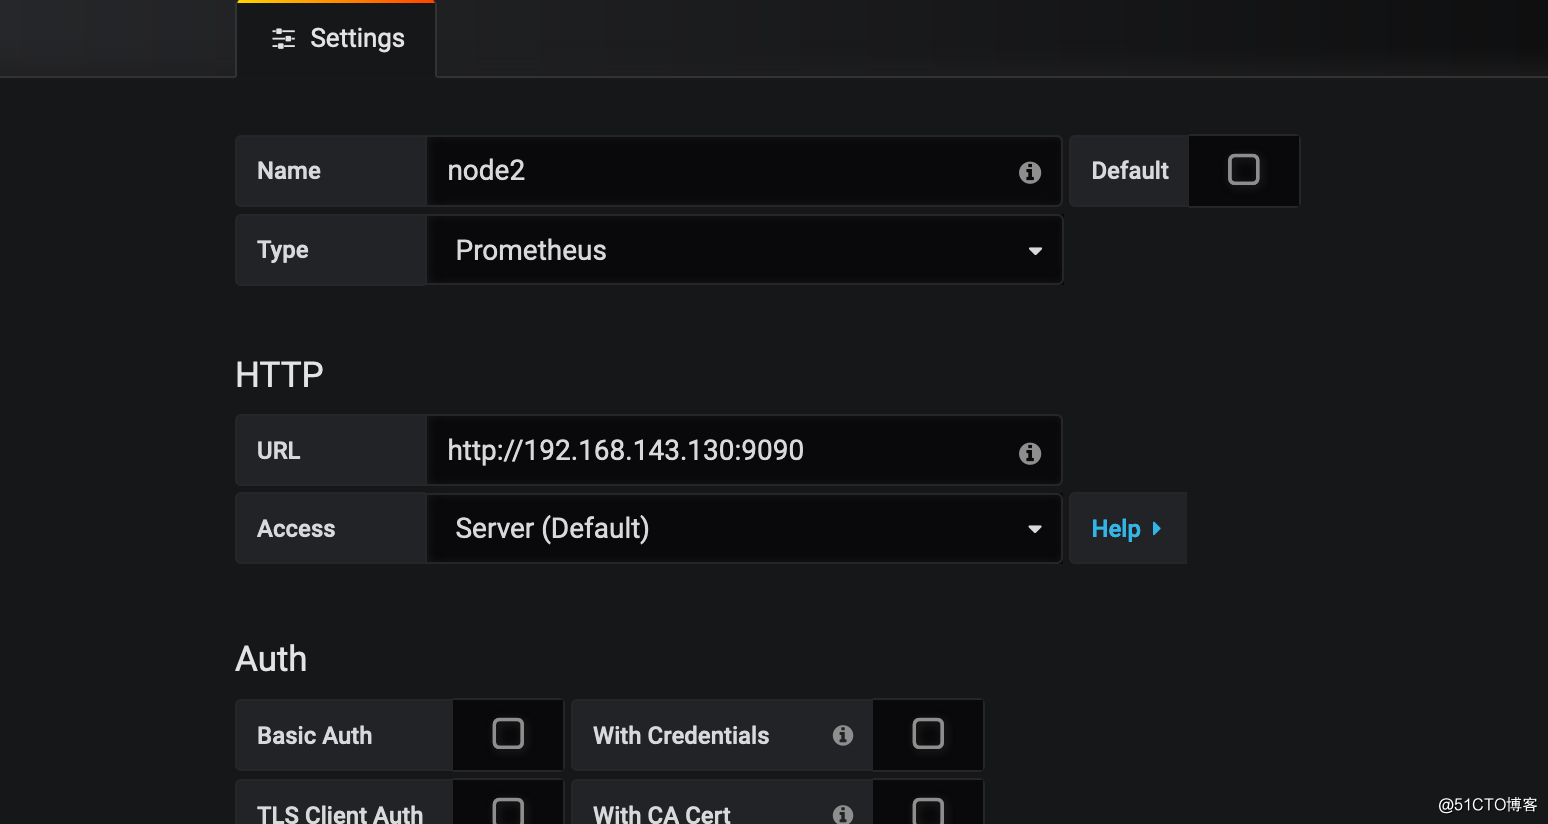
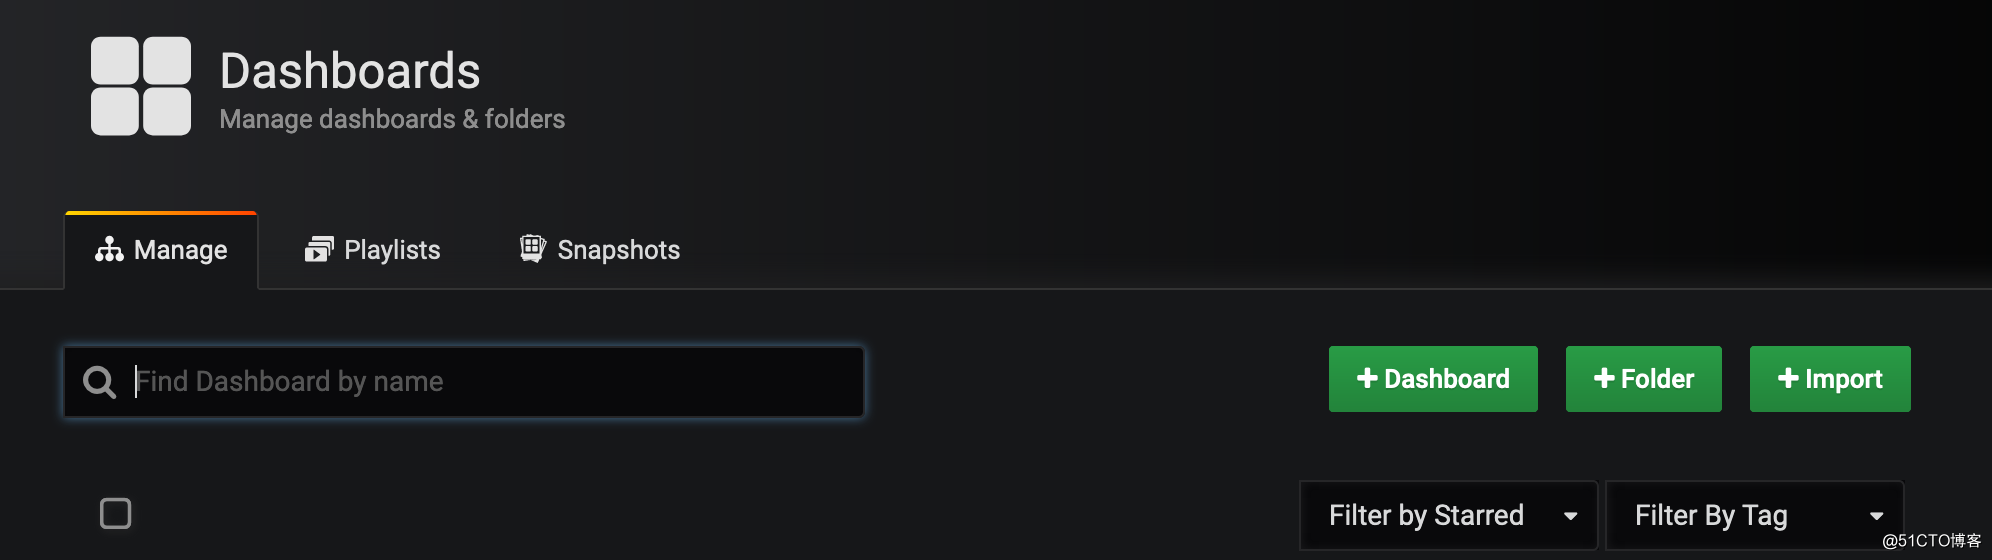
4.3、添加dashboard
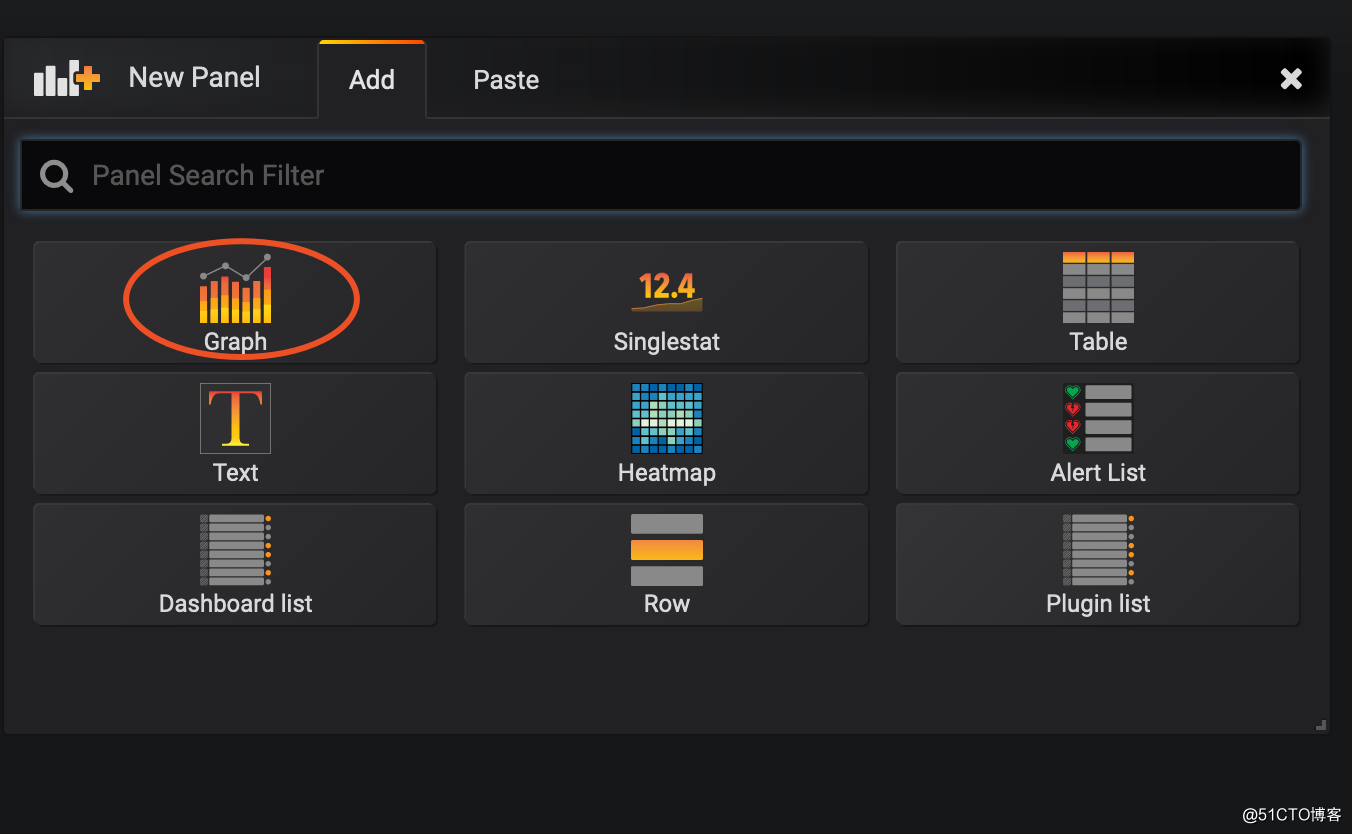
4.4、添加graph
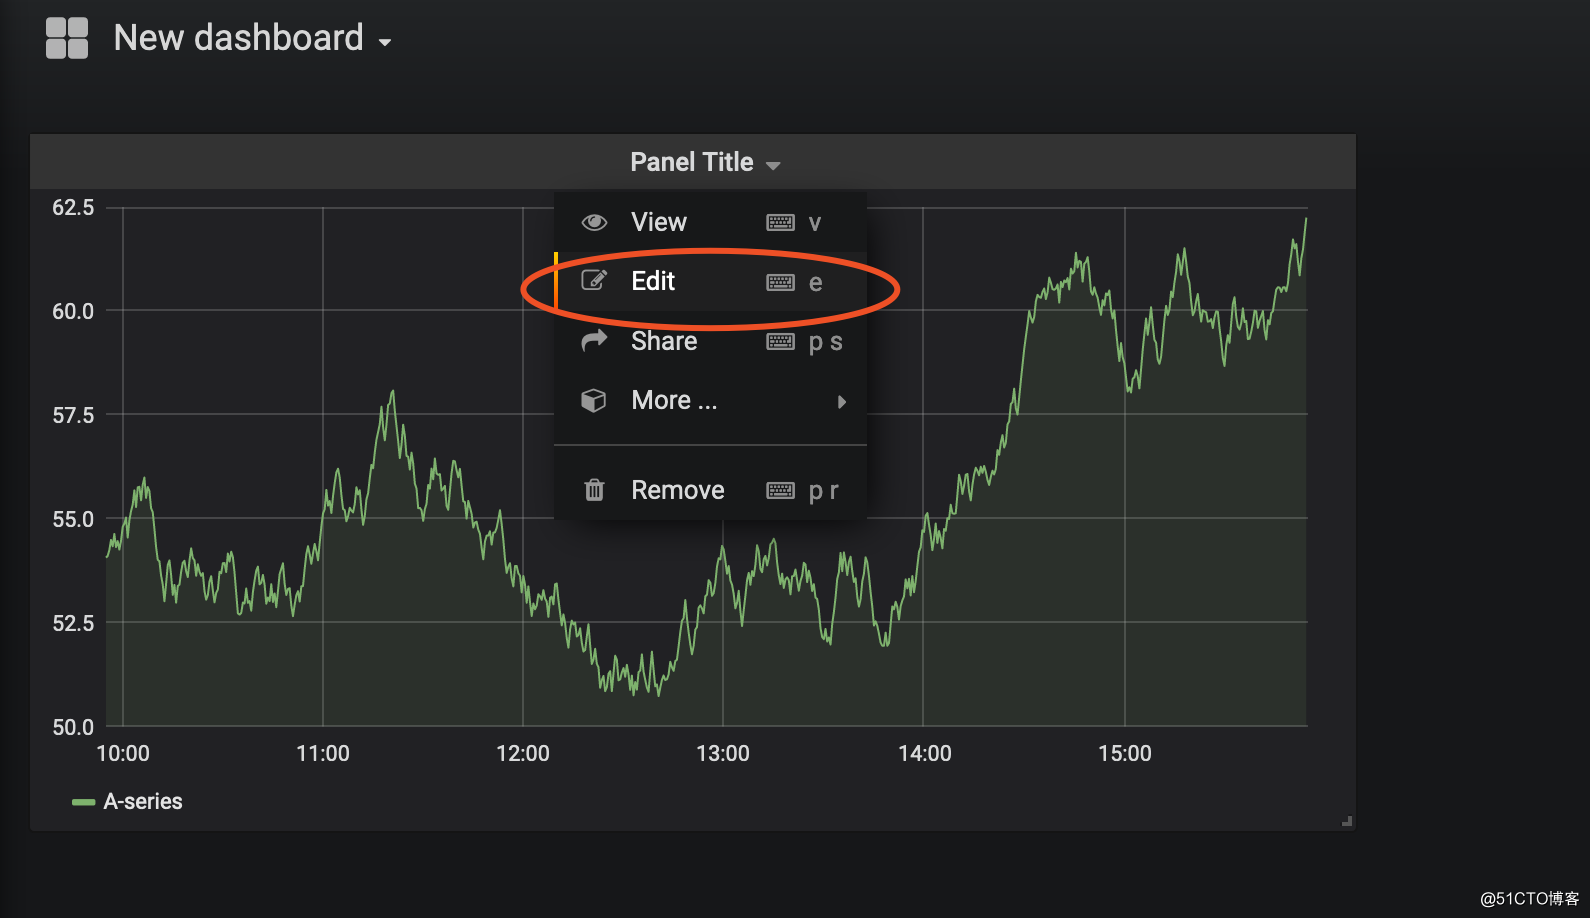
4.5、編輯graph
在DataSource選擇添加好的數據源,在空白處填入監控公式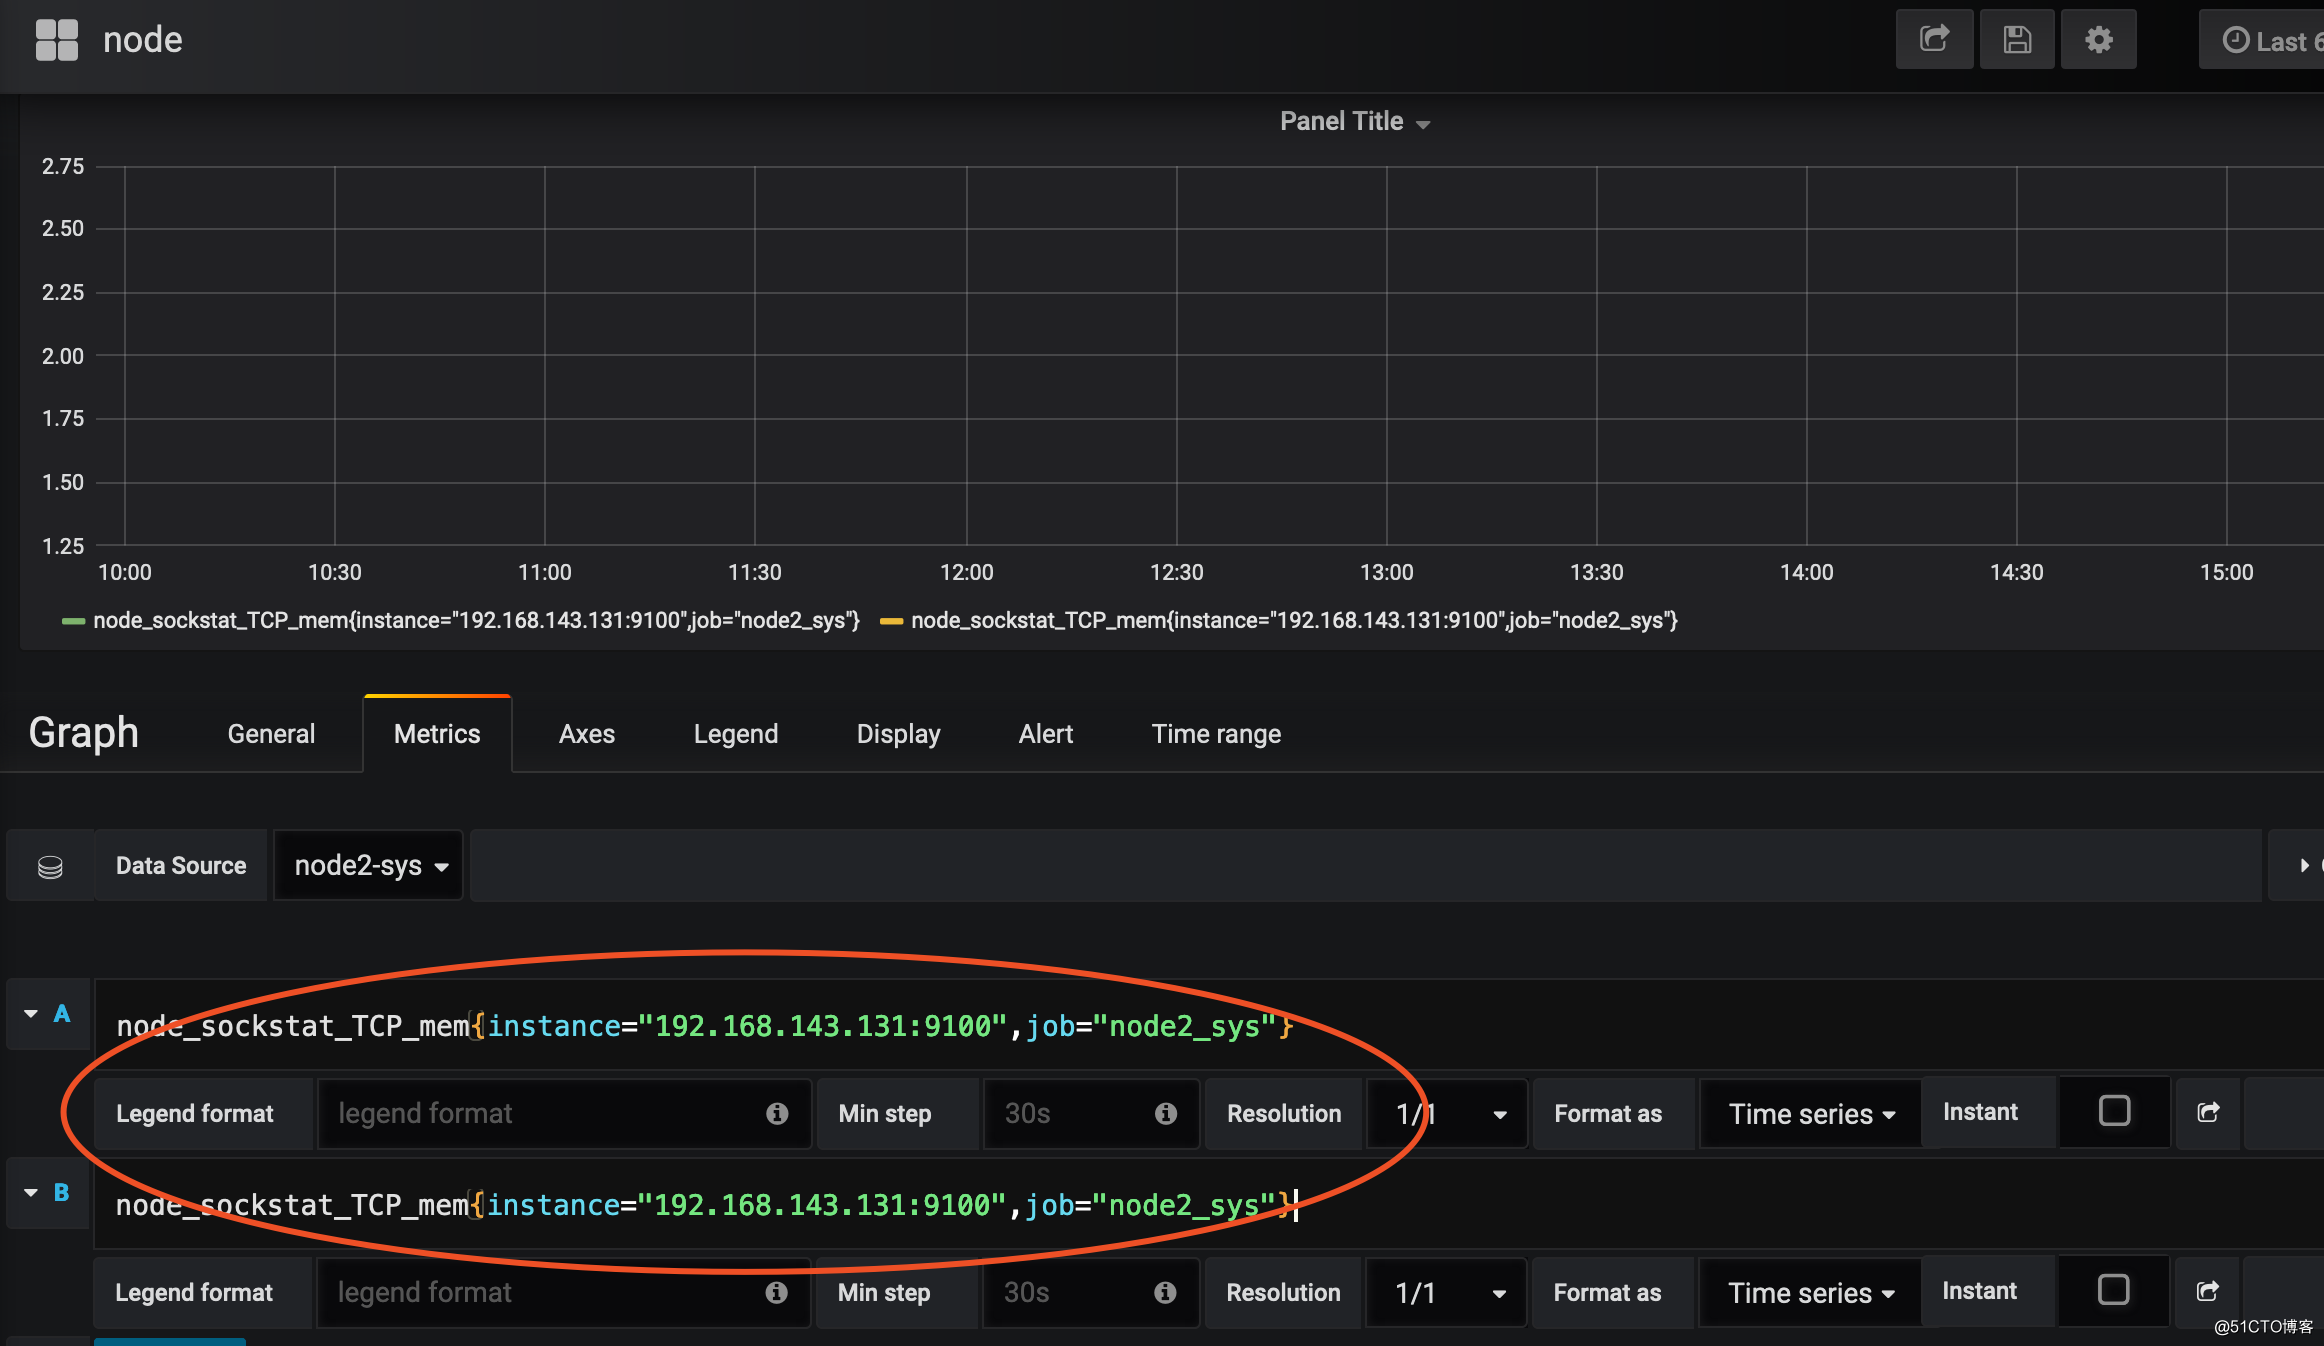
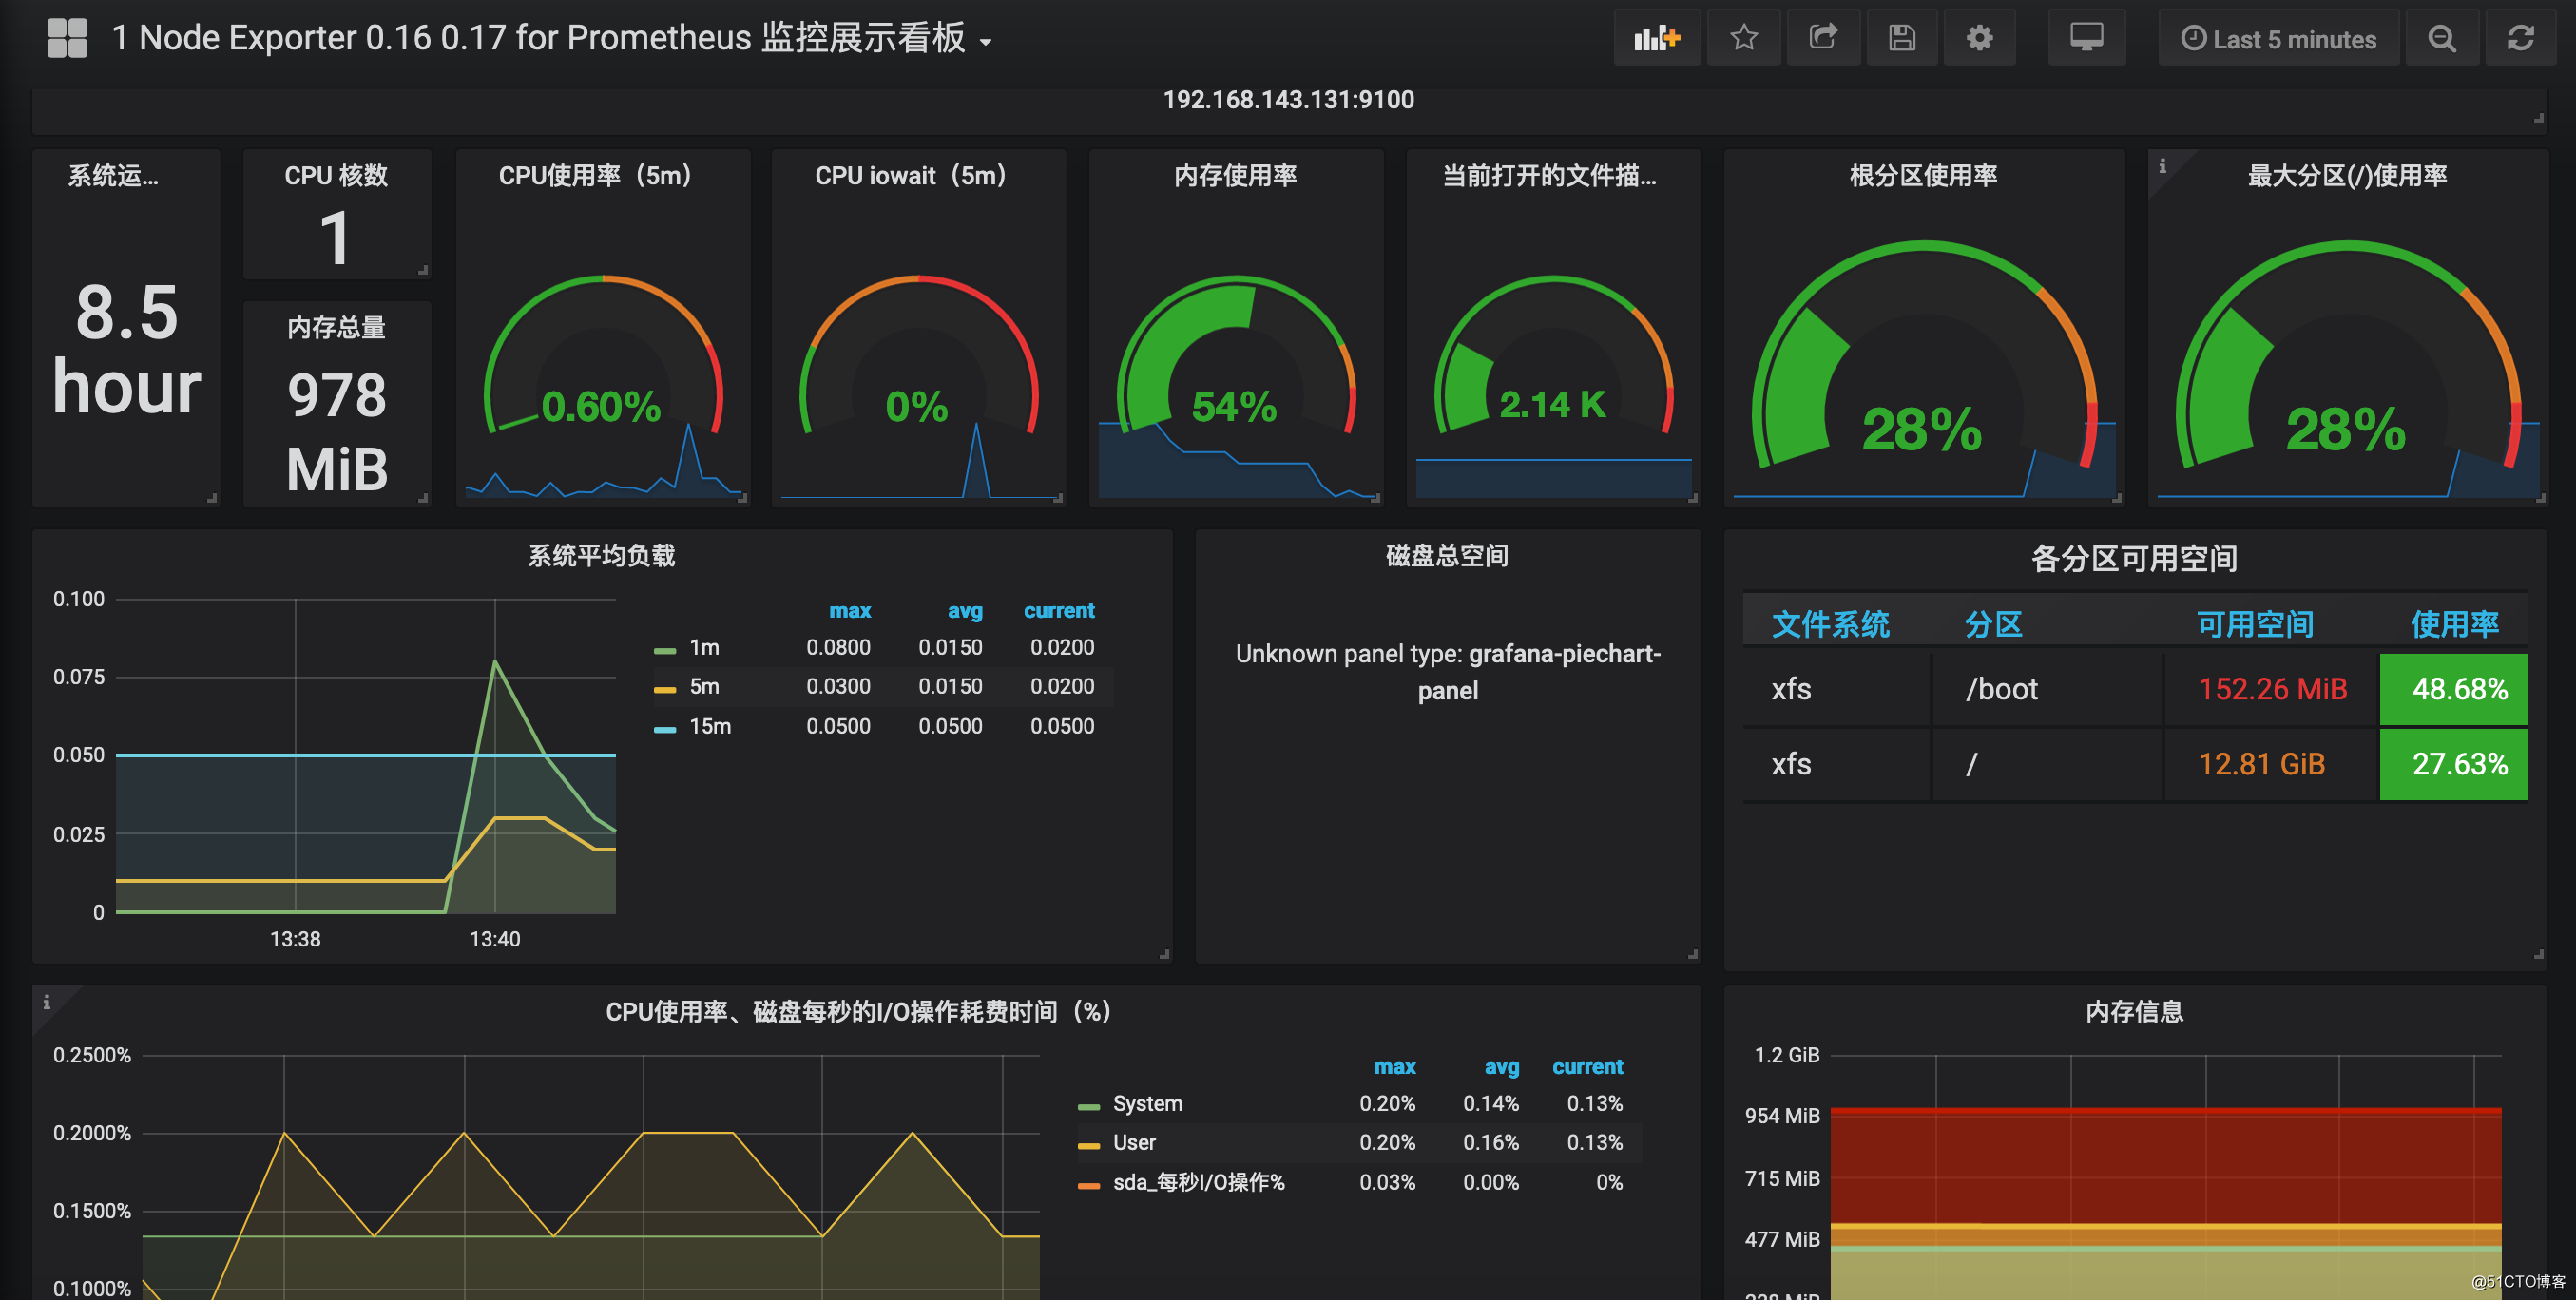
4.6、使用網絡中現有的表盤模版
import導入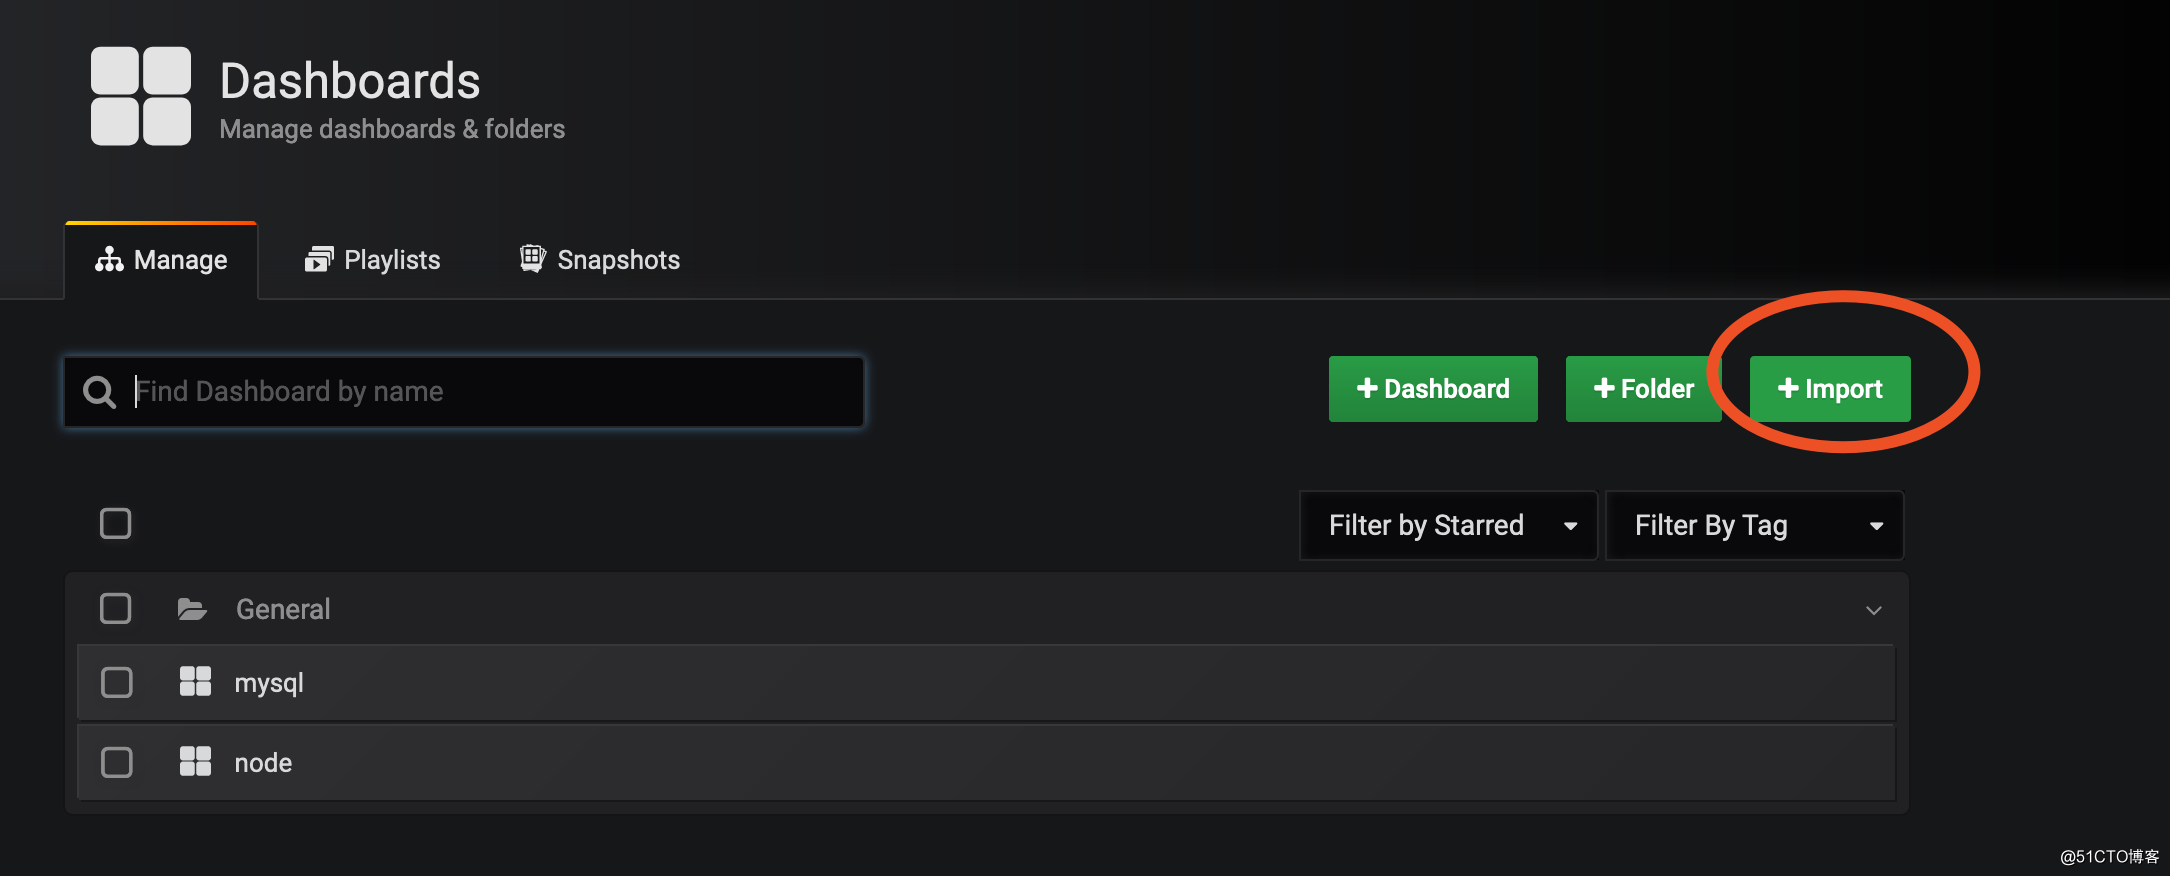
輸入表盤模版url: https://grafana.com/dashboards/8919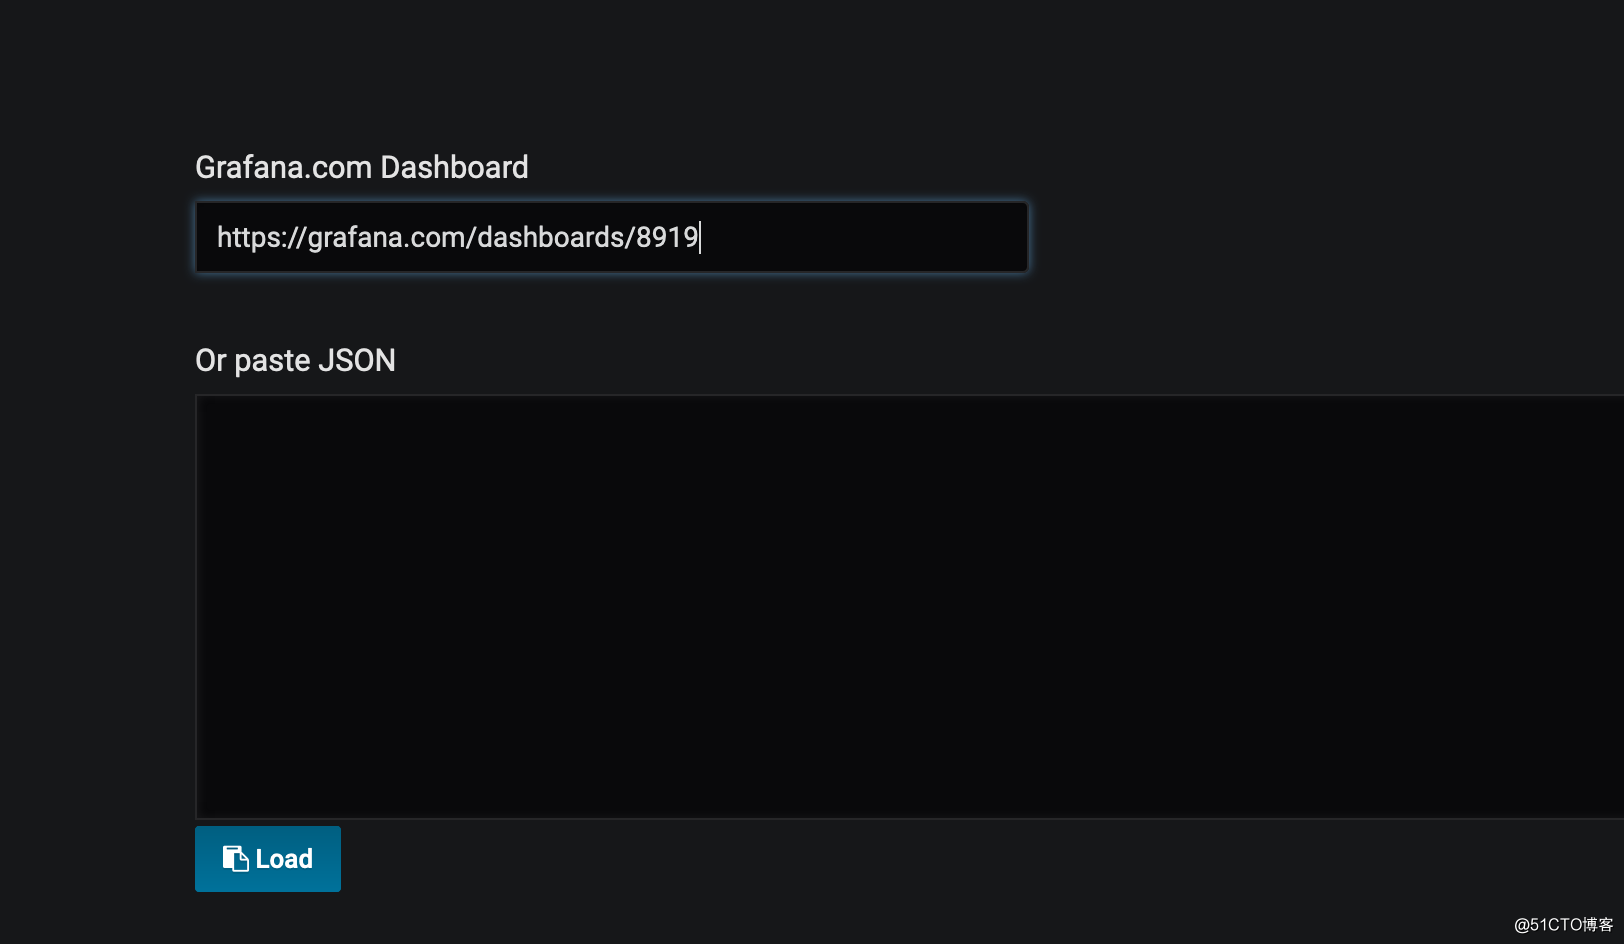
選擇數據源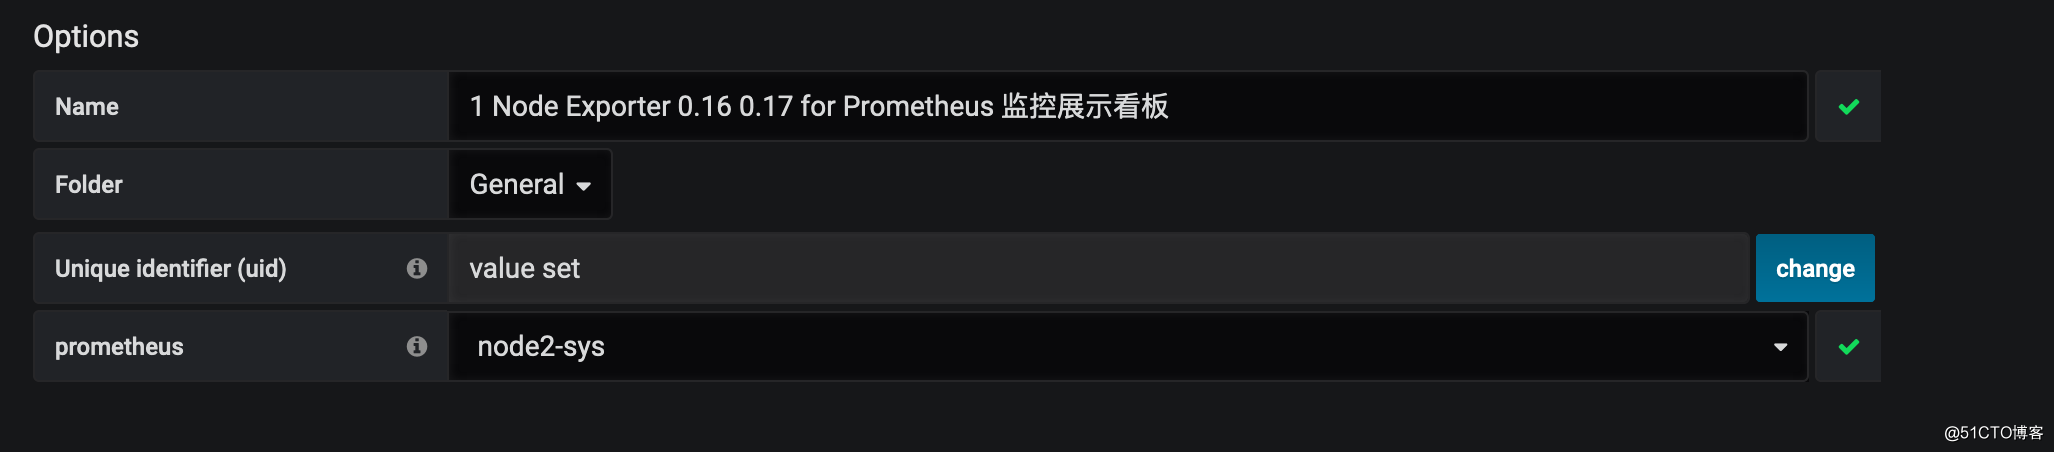
五、自定義監控腳本
5.1、啟動時加參數定義監控腳本采集信息輸出目錄
啟動時加參數--collector.textfile.directory
[[email protected] node_exporter]# cat /usr/lib/systemd/system/node_exporter.service
[Unit]
Description=Prometheus
Documentation=https://prometheus.io/
After=network.target
[Service]
Type=simple
User=prometheus
ExecStart=/usr/local/node_exporter/node_exporter --web.listen-address=:9100 --collector.textfile.directory=/usr/local/node_exporter
Restart=on-failure
[Install]
WantedBy=multi-user.target
5.2、自定義監控腳本
[[email protected] node_exporter]# cat mysql_status.sh
#!/bin/bash
systemctl status mariadb.service |grep running &>/dev/null
if [ $? -eq 0 ];then
    echo "mysql_status 0"
else
    echo "mysql_status 1"
fi
5.3、腳本輸出格式
後綴為.prom,文件中存自定義的key value值
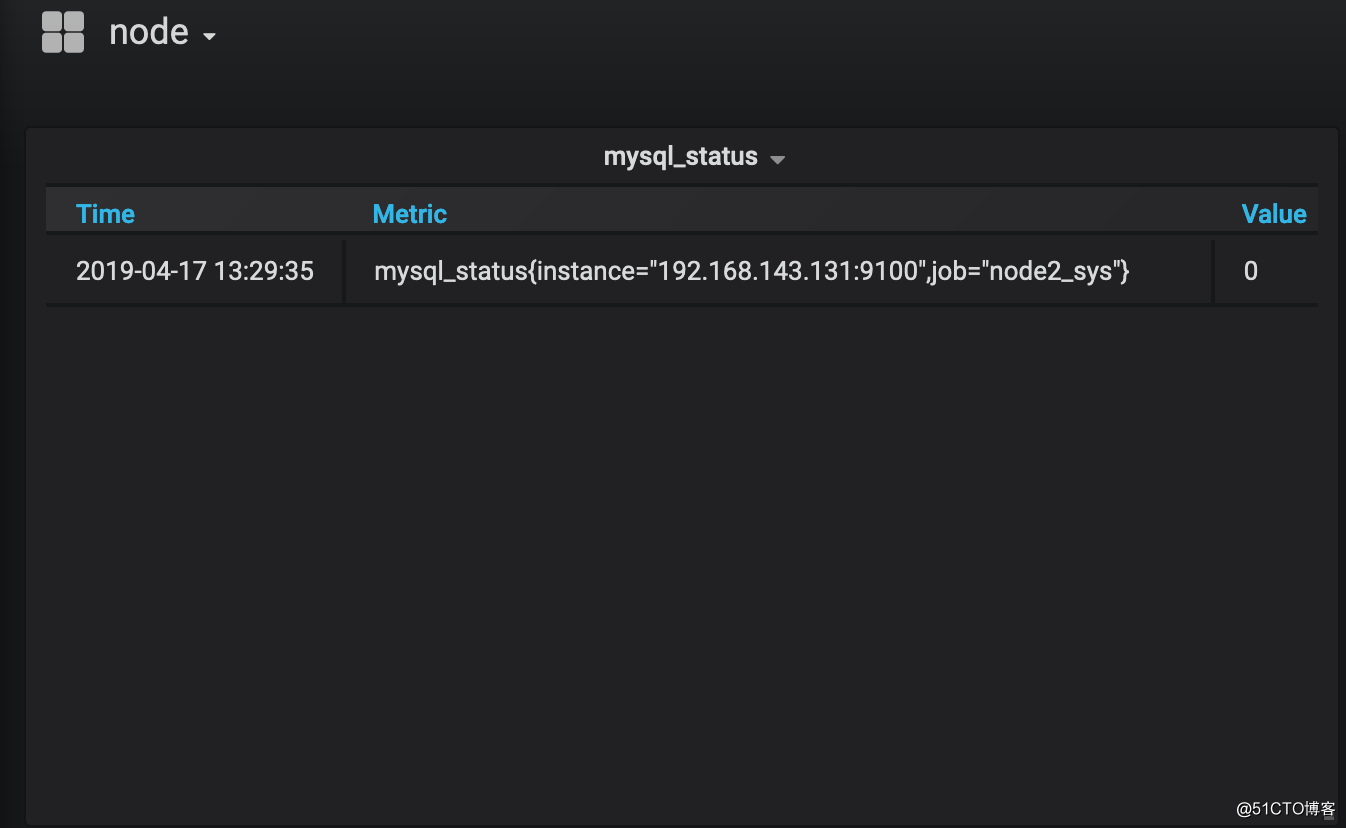
./mysql_status.sh >mysql_status.prom5.4、prometheus以采集到mysql_status信息
5.5、grafana添加圖表
參考文章
? Prometheus github:https://github.com/prometheus
? grafana github:https://github.com/grafana/grafana
? Prometheus node_exporter:https://github.com/prometheus/node_exporter
? Prometheus配置文件詳解:https://prometheus.io/docs/prometheus/latest/configuration/configuration/
? 公司大牛寫的部署文檔
Grafana+prometheus監控體系實踐