
SpringBoot Actuator監控應用
微服務的特點決定了功能模組的部署是分散式的,大部分功能模組都是執行在不同的機器上,彼此通過服務呼叫進行互動,前後臺的業務流會經過很多個微服務的處理和傳遞,出現異常如何快速定位便成為了一個問題,在這種框架下微服務的監控顯得尤為重要。
Spring Boot 是一個自帶監控的開源框架,元件 Spring Boot Actuator 負責監控應用的各項靜態和動態的變數。專案結合 Spring Boot Actuator 的使用,便可輕鬆對 Spring Boot 應用監控治理,Spring Boot 的 Actuator 提供了很多生產級的特性,比如監控和度量 Spring Boot 應用程式,這些特性可以通過眾多 REST 介面、遠端 Shell 和 JMX 獲得。
一、Actuator 監控
Spring Boot 使用“習慣優於配置的理念”,採用包掃描和自動化配置的機制來載入依賴 jar 中的 Spring Bean,不需要任何 XML 配置,就可以實現 Spring 的所有配置。雖然這樣做能讓程式碼變得非常簡潔,但是整個應用的例項建立和依賴關係等資訊都被離散到了各個配置類的註解上,這使得我們分析整個應用中資源和例項的各種關係變得非常的困難。
- 只需要在專案中新增 spring-boot-starter-actuator,就自動啟用了監控功能。
<dependencies>
  <dependency>
    <groupId>org.springframework.boot</groupId>
    <artifactId>spring-boot-starter-web</artifactId>
  </dependency>
  <dependency>
      <groupId>org.springframework.boot</groupId>
      <artifactId>spring-boot-starter-actuator</artifactId>
  </dependency>
</dependencies>
-
新增 spring-boot-starter-web 主要是為了保持應用執行狀態。
-
Spring Boot Actuator 是 Spring Boot 提供的對應用系統的檢查和監控的整合功能,可以檢視應用配置的詳細資訊,例如自動化配置資訊、建立的 Spring beans 以及一些環境屬性等。
二、Actuator 的 REST 介面
-
Actuator 監控分成兩類:原生端點和使用者自定義端點。自定義端點主要是指擴充套件性,使用者可以根據自己的實際應用,定義一些比較關心的指標,在執行期進行監控。
-
原生端點是在應用程式裡提供眾多 Web 介面,通過它們瞭解應用程式執行時的內部狀況,原生端點又可以分成三類:
- 應用配置類,可以檢視應用在執行期的靜態資訊,例如自動配置資訊、載入的 springbean 資訊、yml 檔案配置資訊、環境資訊、請求對映資訊;
- 度量指標類,主要是執行期的動態資訊,如堆疊、請求連、一些健康指標、metrics 資訊等;
- 操作控制類,主要是指 shutdown,使用者可以傳送一個請求將應用的監控功能關閉。
-
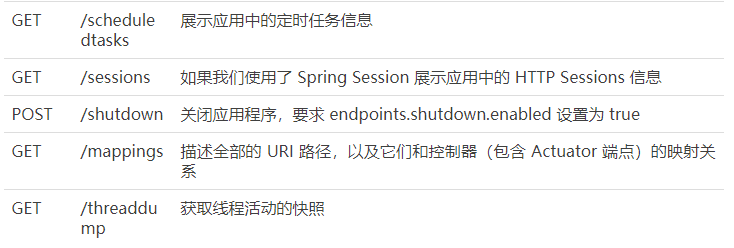
Actuator 提供了 13 個介面,具體如下表所示。
-
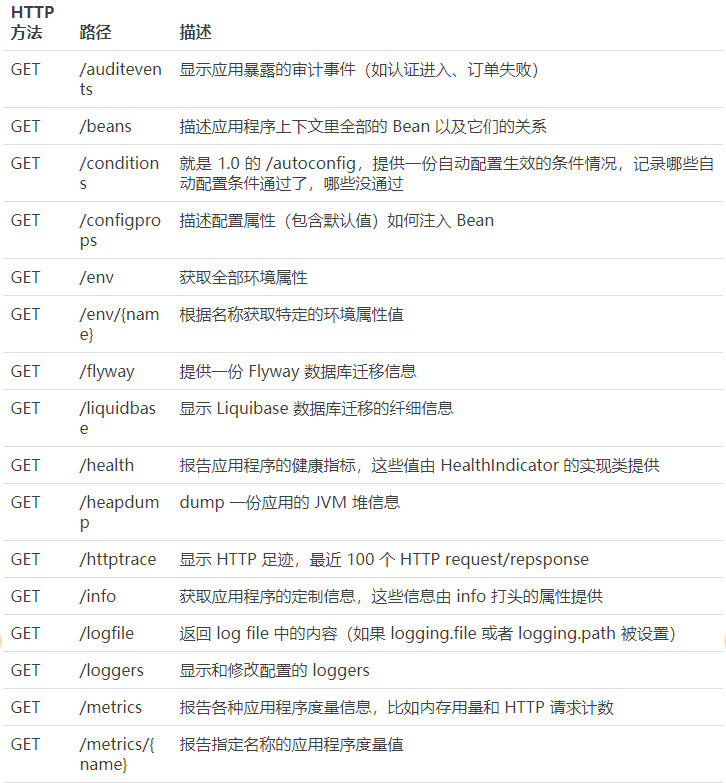
-
三、命令詳解
- 在 Spring Boot 2.x 中為了安全起見,Actuator 只開放了兩個端點 /actuator/health 和 /actuator/info,可以在配置檔案中設定開啟。
- 可以開啟所有的監控點:
management.endpoints.web.exposure.include=*
- 也可以選擇開啟部分:
management.endpoints.web.exposure.exclude=beans,trace
- Actuator 預設所有的監控點路徑都在 /actuator/*,當然如果有需要這個路徑也支援定製。
// 設定完重啟後,再次訪問地址就會變成 /manage/*
management.endpoints.web.base-path=/manage
- Actuator 幾乎監控了應用涉及的方方面面,我們重點講述一些經常在專案中常用的命令。
1、health
-
health 主要用來檢查應用的執行狀態,這是我們使用最高頻的一個監控點,通常使用此介面提醒我們應用例項的執行狀態,以及應用不“健康”的原因,如資料庫連線、磁碟空間不夠等。
-
預設情況下 health 的狀態是開放的,新增依賴後啟動專案,訪問:
http://localhost:8080/actuator/health即可看到應用的狀態。
{
    "status" : "UP"
}
-
預設情況下,最終的 Spring Boot 應用的狀態是由 HealthAggregator 彙總而成的,彙總的演算法是:
- 設定狀態碼順序為 setStatusOrder(Status.DOWN, Status.OUTOFSERVICE, Status.UP, Status.UNKNOWN);
- 過濾掉不能識別的狀態碼
- 如果無任何狀態碼,整個 Spring Boot 應用的狀態是 UNKNOWN
- 將所有收集到的狀態碼按照 1 中的順序排序
- 返回有序狀態碼序列中的第一個狀態碼,作為整個 Spring Boot 應用的狀態
-
health 通過合併幾個健康指數檢查應用的健康情況。Spring Boot Actuator 有幾個預定義的健康指標比如 DataSourceHealthIndicator、DiskSpaceHealthIndicator、MongoHealthIndicator、RedisHealthIndicator 等,它使用這些健康指標作為健康檢查的一部分。
-
舉個例子,如果你的應用使用 Redis,RedisHealthindicator 將被當作檢查的一部分;如果使用 MongoDB,那麼 MongoHealthIndicator 將被當作檢查的一部分。
-
可以在配置檔案中關閉特定的健康檢查指標,比如關閉 Redis 的健康檢查:
management.health.redise.enabled=false
-
預設所有的這些健康指標被當作健康檢查的一部分。
-
詳細的健康檢查資訊
-
預設只是展示了簡單的 UP 和 DOWN 狀態,為了查詢更詳細的監控指標資訊,可以在配置檔案中新增以下資訊:
management.endpoint.health.show-details=always
- 重啟後再次訪問網址
http://localhost:8080/actuator/health,返回資訊如下:
{
  "status": "UP",
  "diskSpace": {
    "status": "UP",
    "total": 209715195904,
    "free": 183253909504,
    "threshold": 10485760
  }
}
- 可以看到 HealthEndPoint 給我們提供預設的監控結果,包含磁碟空間描述總磁碟空間,剩餘的磁碟空間和最小閾值。
其實看 Spring Boot-actuator 原始碼,會發現 HealthEndPoint 提供的資訊不僅限於此,在 org.springframework.boot.actuate.health 包下會發現 ElasticsearchHealthIndicator、RedisHealthIndicator、RabbitHealthIndicator 等。
2、info
- info 是我們自己在配置檔案中以 info 開頭的配置資訊,比如在示例專案中的配置是:
info.app.name=spring-boot-actuator
info.app.version= 1.0.0
info.app.test= test
- 啟動示例專案,訪問
http://localhost:8080/actuator/info返回部分資訊如下:
{
  "app": {
    "name": "spring-boot-actuator",
    "version": "1.0.0",
    "test":"test"
  }
}
3、beans
- 根據示例就可以看出,展示了 bean 的別名、型別、是否單例、類的地址、依賴等資訊。
- 啟動示例專案,訪問網址
http://localhost:8080/actuator/beans返回部分資訊如下:
[
  {
    "context": "application:8080:management",
    "parent": "application:8080",
    "beans": [
      {
        "bean": "embeddedServletContainerFactory",
        "aliases": [

        ],
        "scope": "singleton",
        "type": "org.springframework.boot.context.embedded.tomcat.TomcatEmbeddedServletContainerFactory",
        "resource": "null",
        "dependencies": [

        ]
      },
      {
        "bean": "endpointWebMvcChildContextConfiguration",
        "aliases": [

        ],
        "scope": "singleton",
        "type": "org.springframework.boot.actuate.autoconfigure.EndpointWebMvcChildContextConfiguration$$EnhancerBySpringCGLIB$$a4a10f9d",
        "resource": "null",
        "dependencies": [

        ]
      }
  }
]
4、conditions
-
Spring Boot 的自動配置功能非常便利,但有時候也意味著出問題比較難找出具體的原因。使用 conditions 可以在應用執行時檢視程式碼瞭解某個配置在什麼條件下生效,或者某個自動配置為什麼沒有生效。
-
啟動示例專案,訪問網址
http://localhost:8080/actuator/conditions返回部分資訊如下:
{
    "positiveMatches": {
     "DevToolsDataSourceAutoConfiguration": {
            "notMatched": [
                {
                    "condition": "DevToolsDataSourceAutoConfiguration.DevToolsDataSourceCondition",
                    "message": "DevTools DataSource Condition did not find a single DataSource bean"
                }
            ],
            "matched": [ ]
        },
        "RemoteDevToolsAutoConfiguration": {
            "notMatched": [
                {
                    "condition": "OnPropertyCondition",
                    "message": "@ConditionalOnProperty (spring.devtools.remote.secret) did not find property 'secret'"
                }
            ],
            "matched": [
                {
                    "condition": "OnClassCondition",
                    "message": "@ConditionalOnClass found required classes 'javax.servlet.Filter', 'org.springframework.http.server.ServerHttpRequest'; @ConditionalOnMissingClass did not find unwanted class"
                }
            ]
        }
    }
}
5、configprops
- 檢視配置檔案中設定的屬性內容以及一些配置屬性的預設值。
- 啟動示例專案,訪問網址
http://localhost:8080/actuator/configprops返回部分資訊如下:
{
  ...
  "environmentEndpoint": {
    "prefix": "endpoints.env",
    "properties": {
      "id": "env",
      "sensitive": true,
      "enabled": true
    }
  },
  "spring.http.multipart-org.springframework.boot.autoconfigure.web.MultipartProperties": {
    "prefix": "spring.http.multipart",
    "properties": {
      "maxRequestSize": "10MB",
      "fileSizeThreshold": "0",
      "location": null,
      "maxFileSize": "1MB",
      "enabled": true,
      "resolveLazily": false
    }
  },
  "infoEndpoint": {
    "prefix": "endpoints.info",
    "properties": {
      "id": "info",
      "sensitive": false,
      "enabled": true
    }
  }
  ...
}
6、env
-
展示了系統環境變數的配置資訊,包括使用的環境變數、JVM 屬性、命令列引數、專案使用的 jar 包等資訊。和 configprops 不同的是,configprops 關注於配置資訊,env 關注執行環境資訊。
-
啟動示例專案,訪問網址
http://localhost:8080/actuator/env返回部分資訊如下:
{
  "profiles": [

  ],
  "server.ports": {
    "local.management.port": 8088,
    "local.server.port": 8080
  },
  "servletContextInitParams": {

  },
  "systemProperties": {
    "com.sun.management.jmxremote.authenticate": "false",
    "java.runtime.name": "Java(TM) SE Runtime Environment",
    "spring.output.ansi.enabled": "always",
    "sun.boot.library.path": "C:\\Program Files\\Java\\jdk1.8.0_101\\jre\\bin",
    "java.vm.version": "25.101-b13",
    "java.vm.vendor": "Oracle Corporation",
    "java.vendor.url": "http://java.oracle.com/",
    "java.rmi.server.randomIDs": "true",
    "path.separator": ";",
    "java.vm.name": "Java HotSpot(TM) 64-Bit Server VM",
    "file.encoding.pkg": "sun.io",
    "user.country": "CN",
    "user.script": "",
    "sun.java.launcher": "SUN_STANDARD",
    "sun.os.patch.level": "",
    "PID": "5268",
    "com.sun.management.jmxremote.port": "60093",
    "java.vm.specification.name": "Java Virtual Machine Spe
- 為了避免敏感資訊暴露到 /env 裡,所有名為 password、secret、key(或者名字中最後一段是這些)的屬性在 /env 裡都會加上“*”。舉個例子,如果有一個屬性名字是 database.password,那麼它在 /env 中的顯示效果是這樣的:
"database.password":"******"
- /env/{name} 用法
就是 env 的擴充套件可以獲取指定配置資訊,比如http://localhost:8080/actuator/env/java.vm.version,返回
{"java.vm.version":"25.101-b13"}
7、heapdump
- 返回一個 GZip 壓縮的 JVM 堆 dump。
- 啟動示例專案,訪問網址
http://localhost:8080/actuator/heapdump會自動生成一個 JVM 的堆檔案 heapdump,我們可以使用 JDK 自帶的 JVM 監控工具 VisualVM 開啟此檔案檢視記憶體快照。類似如下圖: 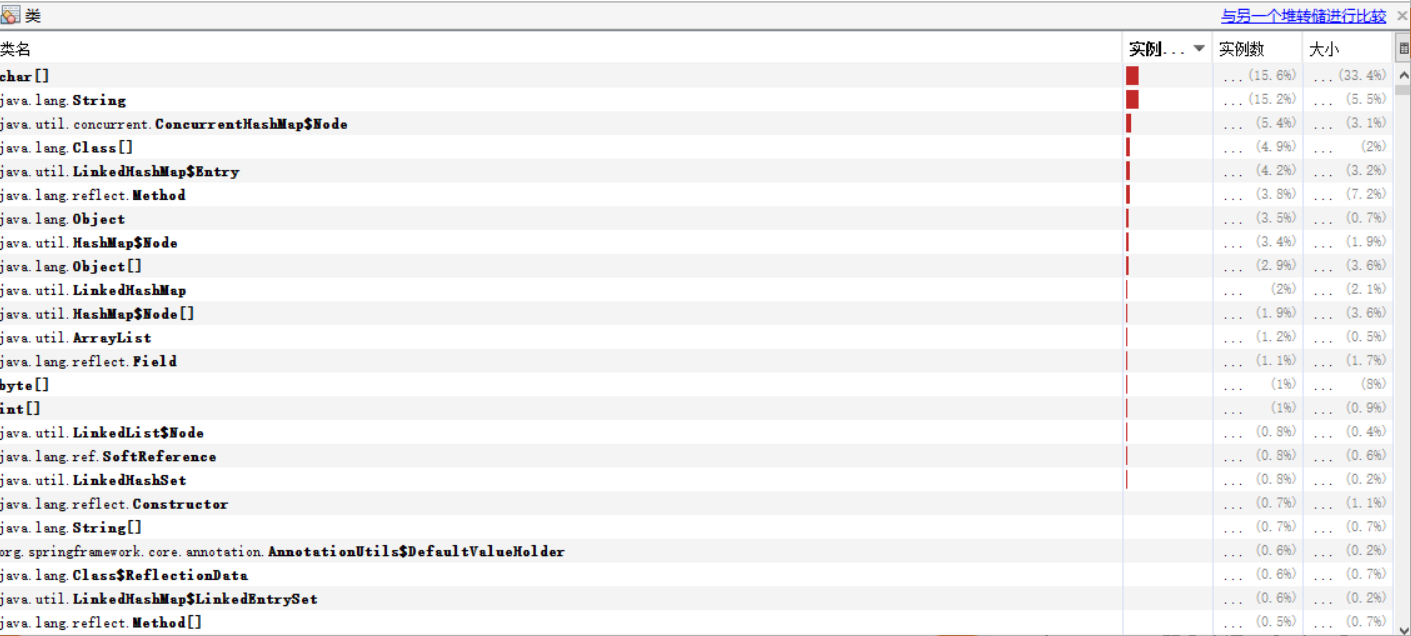
8、httptrace
-
該端點用來返回基本的 HTTP 跟蹤資訊。預設情況下,跟蹤資訊的儲存採用 org.springframework.boot.actuate.trace.InMemoryTraceRepository 實現的記憶體方式,始終保留最近的 100 條請求記錄。
-
啟動示例專案,訪問網址
http://localhost:8080/actuator/httptrace,返回資訊如下:
{
    "traces": [
        {
            "timestamp": "2018-11-21T12:42:25.333Z",
            "principal": null,
            "session": null,
            "request": {
                "method": "GET",
                "uri": "http://localhost:8080/actuator/heapdump",
                "headers": {
                    "cookie": [
                        "Hm_lvt_0fb30c642c5f6453f17d881f529a1141=1513076406,1514961720,1515649377; Hm_lvt_6d8e8bb59814010152d98507a18ad229=1515247964,1515296008,1515672972,1516086283; UM_distinctid=1647364371ef6-003ab9d0469ea5-b7a103e-100200-1647364371f104; CNZZDATA1260945749=232252692-1513233181-%7C1537492730"
                    ],
                    "accept-language": [
                        "zh-CN,zh;q=0.9"
                    ],
                    "upgrade-insecure-requests": [
                        "1"
                    ],
                    "host": [
                        "localhost:8080"
                    ],
                    "connection": [
                        "keep-alive"
                    ],
                    "accept-encoding": [
                        "gzip, deflate, br"
                    ],
                    "accept": [
                        "text/html,application/xhtml+xml,application/xml;q=0.9,image/webp,image/apng,*/*;q=0.8"
                    ],
                    "user-agent": [
                        "Mozilla/5.0 (Windows NT 10.0; Win64; x64) AppleWebKit/537.36 (KHTML, like Gecko) Chrome/63.0.3239.84 Safari/537.36"
                    ]
                },
                "remoteAddress": null
            },
            "response": {
                "status": 200,
                "headers": {
                    "Accept-Ranges": [
                        "bytes"
                    ],
                    "Content-Length": [
                        "39454385"
                    ],
                    "Date": [
                        "Wed, 21 Nov 2018 12:42:25 GMT"
                    ],
                    "Content-Type": [
                        "application/octet-stream"
                    ]
                }
            },
            "timeTaken": 1380
        },
        {
           ...
        },
          ...
    ]
}
- 記錄了請求的整個過程的詳細資訊。
9、metrics
- 最重要的監控內容之一,主要監控了 JVM 內容使用、GC 情況、類載入資訊等。
- 啟動示例專案,訪問網址
http://localhost:8080/actuator/metrics返回部分資訊如下:
{
  "mem": 337132,
  "mem.free": 183380,
  "processors": 4,
  "instance.uptime": 254552,
  "uptime": 259702,
  "systemload.average": -1.0,
  "heap.committed": 292864,
  "heap.init": 129024,
  "heap.used": 109483,
  "heap": 1827840,
  "nonheap.committed": 45248,
  "nonheap.init": 2496,
  "nonheap.used": 44269,
  "nonheap": 0,
  "threads.peak": 63,
  "threads.daemon": 43,
  "threads.totalStarted": 83,
  "threads": 46,
  "classes": 6357,
  "classes.loaded": 6357,
  "classes.unloaded": 0,
  "gc.ps_scavenge.count": 8,
  "gc.ps_scavenge.time": 99,
  "gc.ps_marksweep.count": 1,
  "gc.ps_marksweep.time": 43,
  "httpsessions.max": -1,
  "httpsessions.active": 0
}
-
對 /metrics 介面提供的資訊進行簡單分類如下表:
-
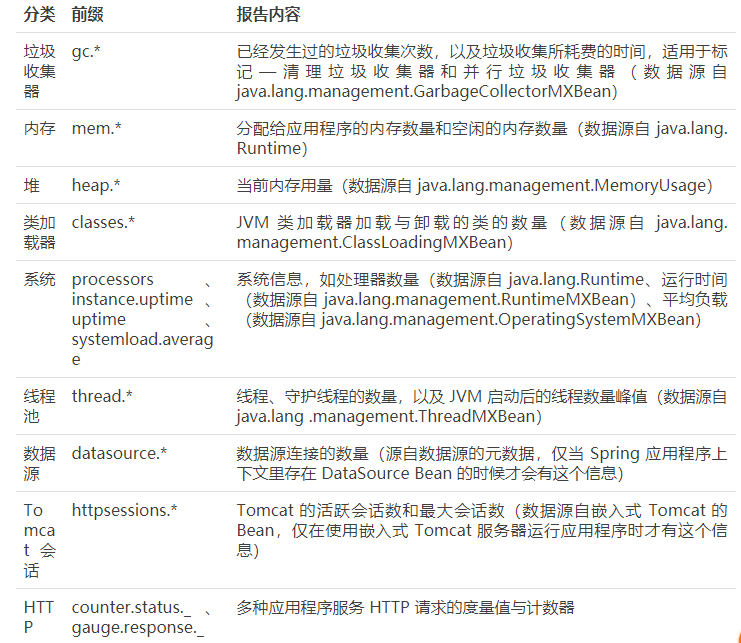
-
解釋說明
- 請注意,這裡的一些度量值,比如資料來源和 Tomcat 會話,僅在應用程式中執行特定元件時才有資料,還可以註冊自己的度量資訊。
- HTTP 的計數器和度量值需要做一點說明,counter.status 後的值是 HTTP 狀態碼,隨後是所請求的路徑。舉個例子,counter.status.200.metrics 表明 /metrics 端點返回 200(OK) 狀態碼的次數。
- HTTP 的度量資訊在結構上也差不多,卻在報告另一類資訊。它們全部以 gauge.response 開頭,表明這是 HTTP 響應的度量資訊,字首後是對應的路徑,度量值是以毫秒為單位的時間,反映了最近處理該路徑請求的耗時。
- 這裡還有幾個特殊的值需要注意,root 路徑指向的是根路徑或/,star-star 代表了那些 Spring 認為是靜態資源的路徑,包括圖片、JavaScript 和樣式表,其中還包含了那些找不到的資源,這就是為什麼經常會看到 counter.status.404.star-star,因為返回了 HTTP 404 (NOT FOUND) 狀態的請求數。
- /metrics 介面會返回所有的可用度量值,但你也可能只對某個值感興趣。要獲取單個值,請求時可以在 URL 後加上對應的鍵名。例如,要檢視空閒記憶體大小,可以向 /metrics/mem.free 發一個GET請求,比如訪問網址
http://localhost:8080/actuator/metrics/mem.free,返回:{"mem.free":178123}。
10、shutdown
- 開啟介面優雅關閉 Spring Boot 應用,要使用這個功能首先需要在配置檔案中開啟:
management.endpoint.shutdown.enabled=true
- 配置完成之後,啟動示例專案,使用 curl 模擬 post 請求訪問 shutdown 介面。
shutdown 介面預設只支援 post 請求。
curl -X POST "http://localhost:8080/actuator/shutdown"
{
    "message": "Shutting down, bye..."
}
- 此時會發現應用已經被關閉。
11、mappings
- 描述全部的 URI 路徑,以及它們和控制器的對映關係。
- 啟動示例專案,訪問網址
http://localhost:8080/actuator/mappings返回部分資訊如下:
{
  "/**/favicon.ico": {
    "bean": "faviconHandlerMapping"
  },
  "{[/hello]}": {
    "bean": "requestMappingHandlerMapping",
    "method": "public java.lang.String com.neo.controller.HelloController.index()"
  },
  "{[/error]}": {
    "bean": "requestMappingHandlerMapping",
    "method": "public org.springframework.http.ResponseEntity<java.util.Map<java.lang.String, java.lang.Object>> org.springframework.boot.autoconfigure.web.BasicErrorController.error(javax.servlet.http.HttpServletRequest)"
  }
}
12、threaddump
-
/threaddump 介面會生成當前執行緒活動的快照,這個功能非常好,方便我們在日常定位問題的時候檢視執行緒的情況,主要展示了執行緒名、執行緒 ID、執行緒的狀態、是否等待鎖資源等資訊。
-
啟動示例專案,訪問網址
http://localhost:8080/actuator/threaddump返回部分資訊如下:
[
  {
    "threadName": "http-nio-8088-exec-6",
    "threadId": 49,
    "blockedTime": -1,
    "blockedCount": 0,
    "waitedTime": -1,
    "waitedCount": 2,
    "lockName": "java.util.concurrent.locks.AbstractQueuedSynchronizer$ConditionObject@1630a501",
    "lockOwnerId": -1,
    "lockOwnerName": null,
    "inNative": false,
    "suspended": false,
    "threadState": "WAITING",
    "stackTrace": [
      {
        "methodName": "park",
        "fileName": "Unsafe.java",
        "lineNumber": -2,
        "className": "sun.misc.Unsafe",
        "nativeMethod": true
      },
      ...
      {
        "methodName": "run",
        "fileName": "TaskThread.java",
        "lineNumber": 61,
        "className": "org.apache.tomcat.util.threads.TaskThread$WrappingRunnable",
        "nativeMethod": false
      }
      ...
    ],
    "lockInfo": {
      "className": "java.util.concurrent.locks.AbstractQueuedSynchronizer$ConditionObject",
      "identityHashCode": 372286721
    }
  }
  ...
]
- 生產出現問題的時候,可以通過應用的執行緒快照來檢測應用正在執行的任務。
四、總結
經過這節課實踐我們發現 Spring Boot Actuator 作為 Spring Boot 自帶的監控元件非常強大,它可以監控和管理 Spring Boot 應用,如健康檢查、審計、統計和 HTTP 追蹤等,所有的這些特性可以通過 JMX 或者 HTTP endpoints 來獲得。使用 Spring Boot Actuator 之後,可以讓我們通過很簡單的介面或者命令來查詢應用的一切執行狀態,從而達到對應用的執行情況瞭如