使用python統計《三國演義》小說里人物出現次數前十名,並實現視覺化。
阿新 • • 發佈:2020-11-24
# 一、安裝所需要的第三方庫
> jieba (jieba是優秀的中文分詞第三分庫)
> pyecharts (一個優秀的資料視覺化庫)
> [《三國演義》.txt下載地址](https://pan.baidu.com/s/10y0C1iE5XEGh1MQy2eQDgg )(提取碼:kist )
## 使用pycharm安裝庫
- 開啟Pycharm選擇【File】下的Settings

- 出現下面頁面,
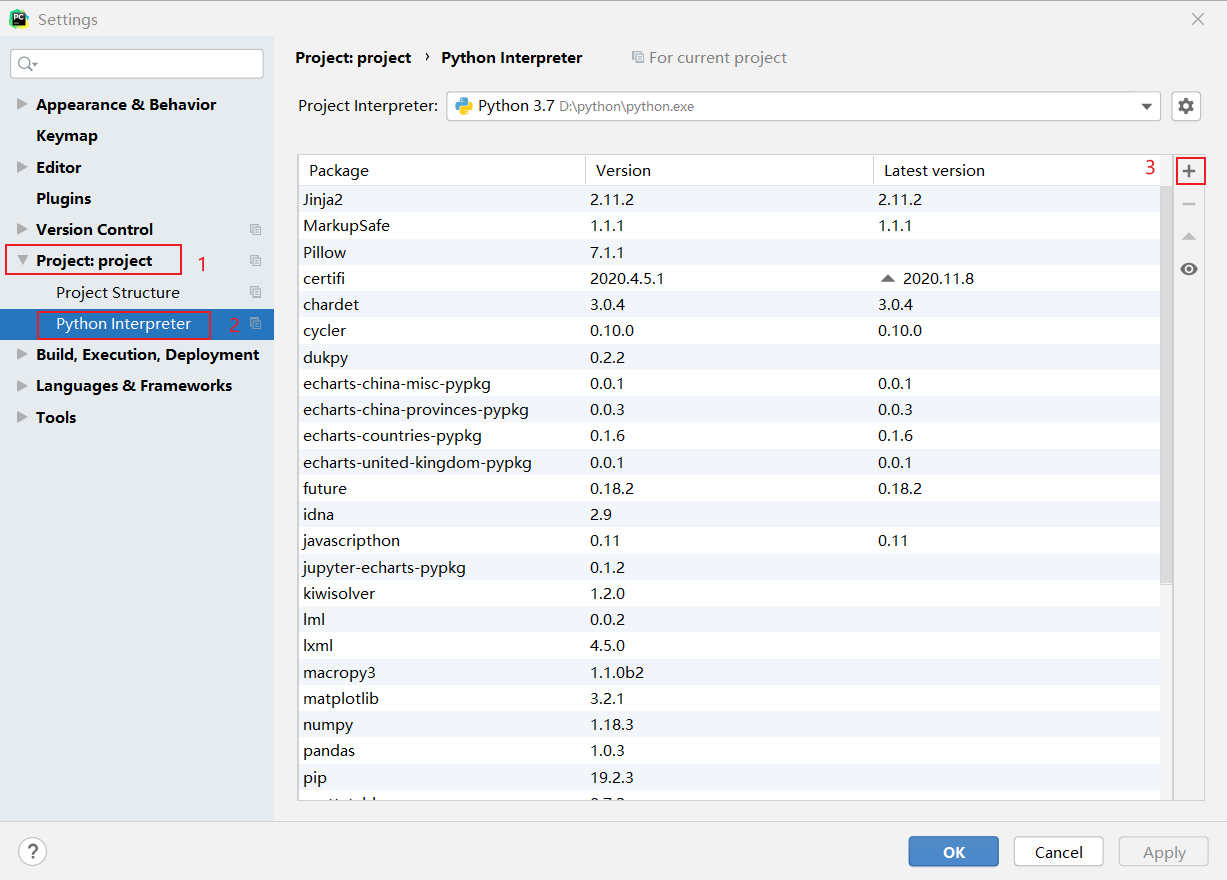
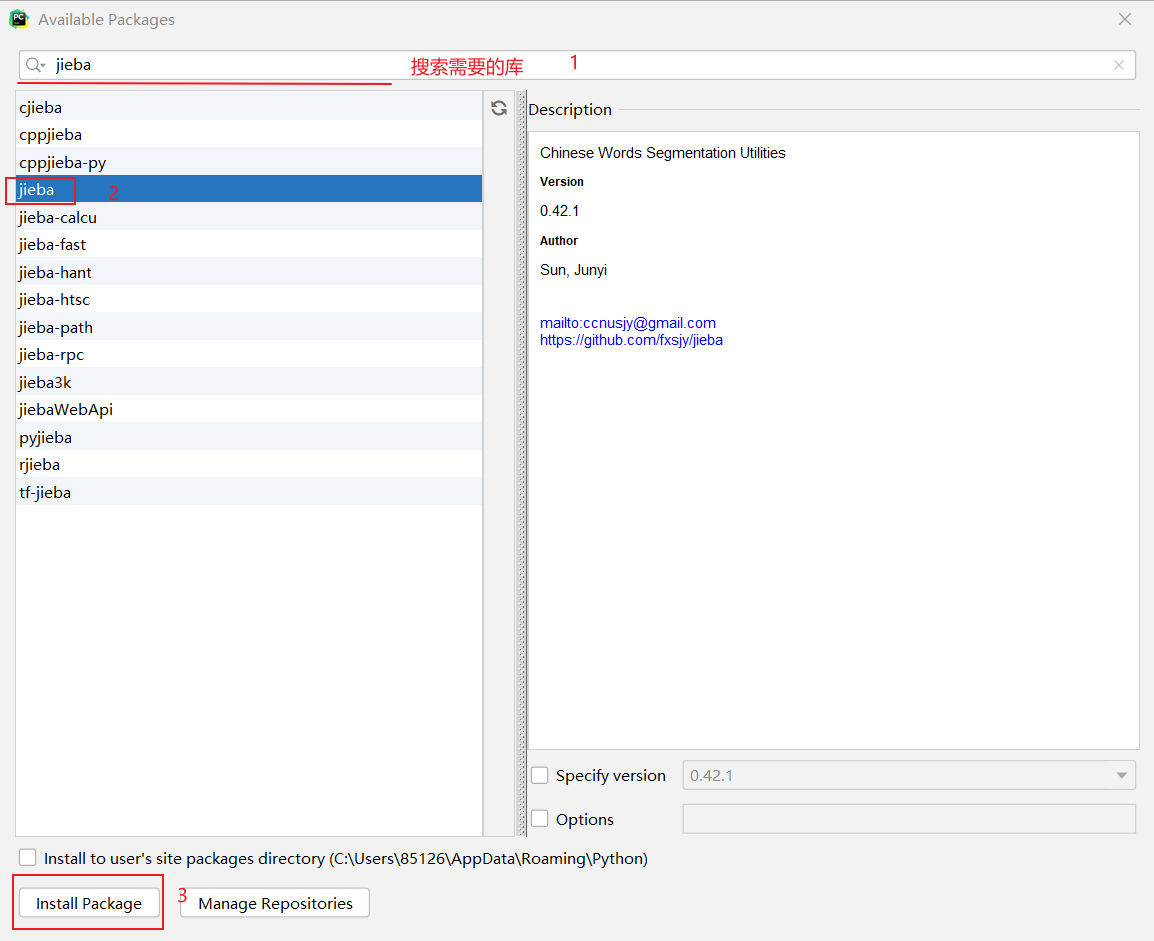
- 選擇右邊的【+】出現下面頁面,在此頁面頂端搜尋想要的庫,然後安裝就可以了
# 二、編寫程式碼
```Python
import jieba #匯入庫
import os
print("人物出現次數前十名:")
txt = open('三國演義.txt', 'r' ,encoding='gb18030').read()
words = jieba.lcut(txt)
counts = {}
for word in words:
if len(word) == 1:
continue
elif word == "諸葛亮" or word == "孔明曰":
rword = "孔明"
elif word == "關公" or word == "雲長":
rword = "關羽"
elif word == "玄德" or word == "玄德曰":
rword = "劉備"
elif word == "孟德" or word == "丞相":
rword = "曹操" # 把相同意思的名字歸為一個人
else:
rword = word
counts[rword] = counts.get(rword, 0) + 1
items = list(counts.items())
items.sort(key=lambda x: x[1], reverse=True)
for i in range(10):
word, count=items[i]
print("{}:{}".format(word, count)) # 列印前十名名單
```
- 結果如下圖:
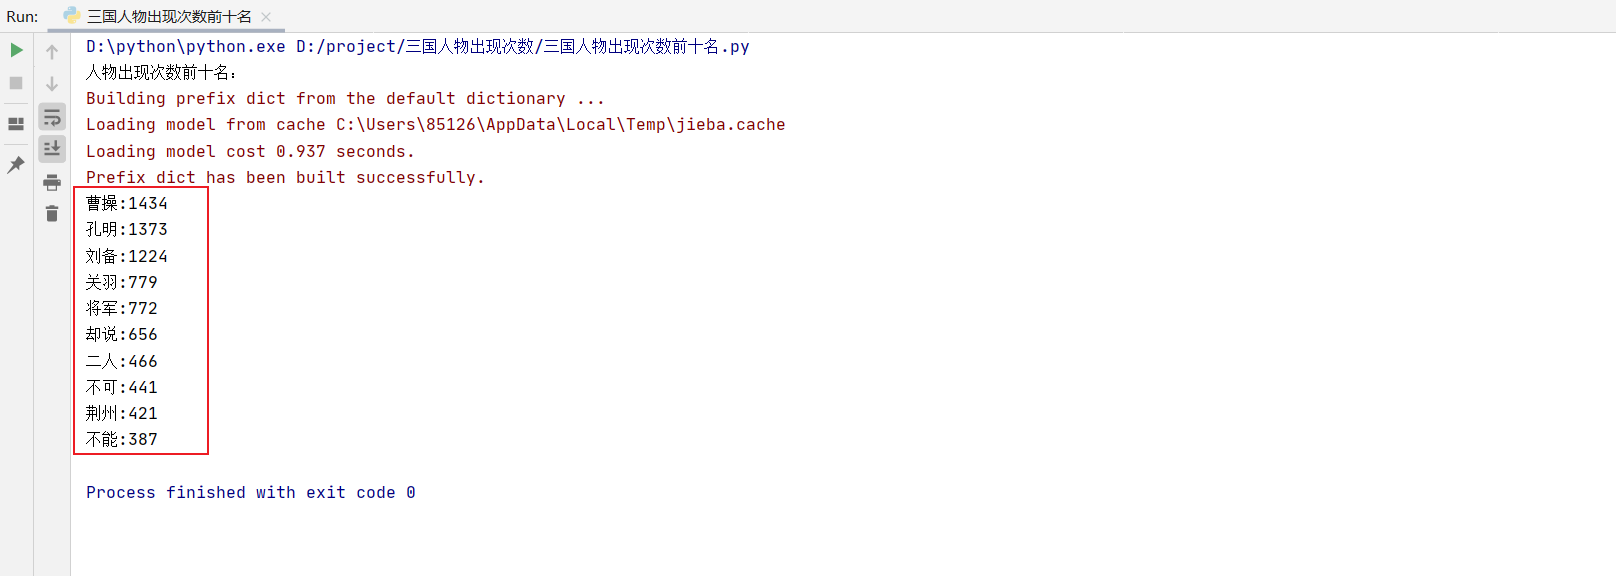
- 可以看到這裡面有很多不是人物的名字,所以咱們要把這些刪掉。更改程式碼如下
```Python
import jieba #匯入庫
import os
print("人物出現次數前十名:")
txt = open('三國演義.txt', 'r' ,encoding='gb18030').read()
remove = {"將軍", "卻說", "不能", "後主", "上馬", "不知", "天子", "大叫", "眾將", "不可",
"主公", "蜀兵", "只見", "如何", "商議", "都督", "一人", "漢中", "人馬",
"陛下", "魏兵", "天下", "今日", "左右", "東吳", "於是", "荊州", "不能", "如此",
"大喜", "引兵", "次日", "軍士", "軍馬","二人","不敢"} # 這些文字是要排出掉的,多次執行程式所得到的
words = jieba.lcut(txt)
counts = {}
for word in words:
if len(word) == 1:
continue
elif word == "諸葛亮" or word == "孔明曰":
rword = "孔明"
elif word == "關公" or word == "雲長":
rword = "關羽"
elif word == "玄德" or word == "玄德曰":
rword = "劉備"
elif word == "孟德" or word == "丞相":
rword = "曹操" # 把相同意思的名字歸為一個人
else:
rword = word
counts[rword] = counts.get(rword, 0) + 1
for word in remove:
del counts[word] #匹配文字相等就刪除
items = list(counts.items())
items.sort(key=lambda x: x[1], reverse=True)
for i in range(10):
word, count=items[i]
print("{}:{}".format(word, count)) # 列印前十名名單
```
- 執行結果如下圖

> 可以看到現在都是人物名稱了
- 匯出資料,程式碼如下
```Python
import jieba #匯入庫
import os
print("人物出現次數前十名:")
txt = open('三國演義.txt', 'r' ,encoding='gb18030').read()
remove = {"將軍", "卻說", "不能", "後主", "上馬", "不知", "天子", "大叫", "眾將", "不可",
"主公", "蜀兵", "只見", "如何", "商議", "都督", "一人", "漢中", "人馬",
"陛下", "魏兵", "天下", "今日", "左右", "東吳", "於是", "荊州", "不能", "如此",
"大喜", "引兵", "次日", "軍士", "軍馬","二人","不敢"} # 這些文字是要排出掉的,多次執行程式所得到的
words = jieba.lcut(txt)
counts = {}
for word in words:
if len(word) == 1:
continue
elif word == "諸葛亮" or word == "孔明曰":
rword = "孔明"
elif word == "關公" or word == "雲長":
rword = "關羽"
elif word == "玄德" or word == "玄德曰":
rword = "劉備"
elif word == "孟德" or word == "丞相":
rword = "曹操" # 把相同意思的名字歸為一個人
else:
rword = word
counts[rword] = counts.get(rword, 0) + 1
for word in remove:
del counts[word] #匹配文字相等就刪除
items = list(counts.items())
items.sort(key=lambda x: x[1], reverse=True)
#匯出資料
fo = open("三國人物出場次數.txt", "a", encoding='utf-8')
for i in range(10):
word, count=items[i]
word = str(word)
count = str(count)
fo.write(word)
fo.write(':') #使用冒號分開
fo.write(count)
fo.write('\n') #換行
fo.close() #關閉檔案
```
- 現在咱們執行看是否匯出,執行結果如下圖。

> 可以看到已經生成一個名為三國人物出場次數.txt的檔案,而檔案裡的內容就是咱們剛才的資料。
# 三、資料視覺化
- 想要視覺化首先咱們要有資料,咱們把剛才匯出的資料轉換為字典形式。程式碼如下
```Python
#將txt文本里的資料轉換為字典形式
fr = open('三國人物出場次數.txt', 'r', encoding='utf-8')
dic = {}
keys = [] # 用來儲存讀取的順序
for line in fr:
v = line.strip().split(':')
dic[v[0]] = v[1]
keys.append(v[0])
fr.close()
print(dic)
```
-執行結果如下

- 使用pyecharts繪圖
- 先倒入模組
```Python
from pyecharts import options as opts
from pyecharts.charts import Bar
```
- 程式碼如下
```Python
# 繪圖
list1=list(dic.keys())
list2=list(dic.values()) #提取字典裡的資料作為繪圖資料
c = (
Bar()
.add_xaxis(list1)
.add_yaxis("人物出場次數",list2)
.set_global_opts(
xaxis_opts=opts.AxisOpts(axislabel_opts=opts.LabelOpts(rotate=-15)),
)
.render("人物出場次數視覺化圖.html")
)
```
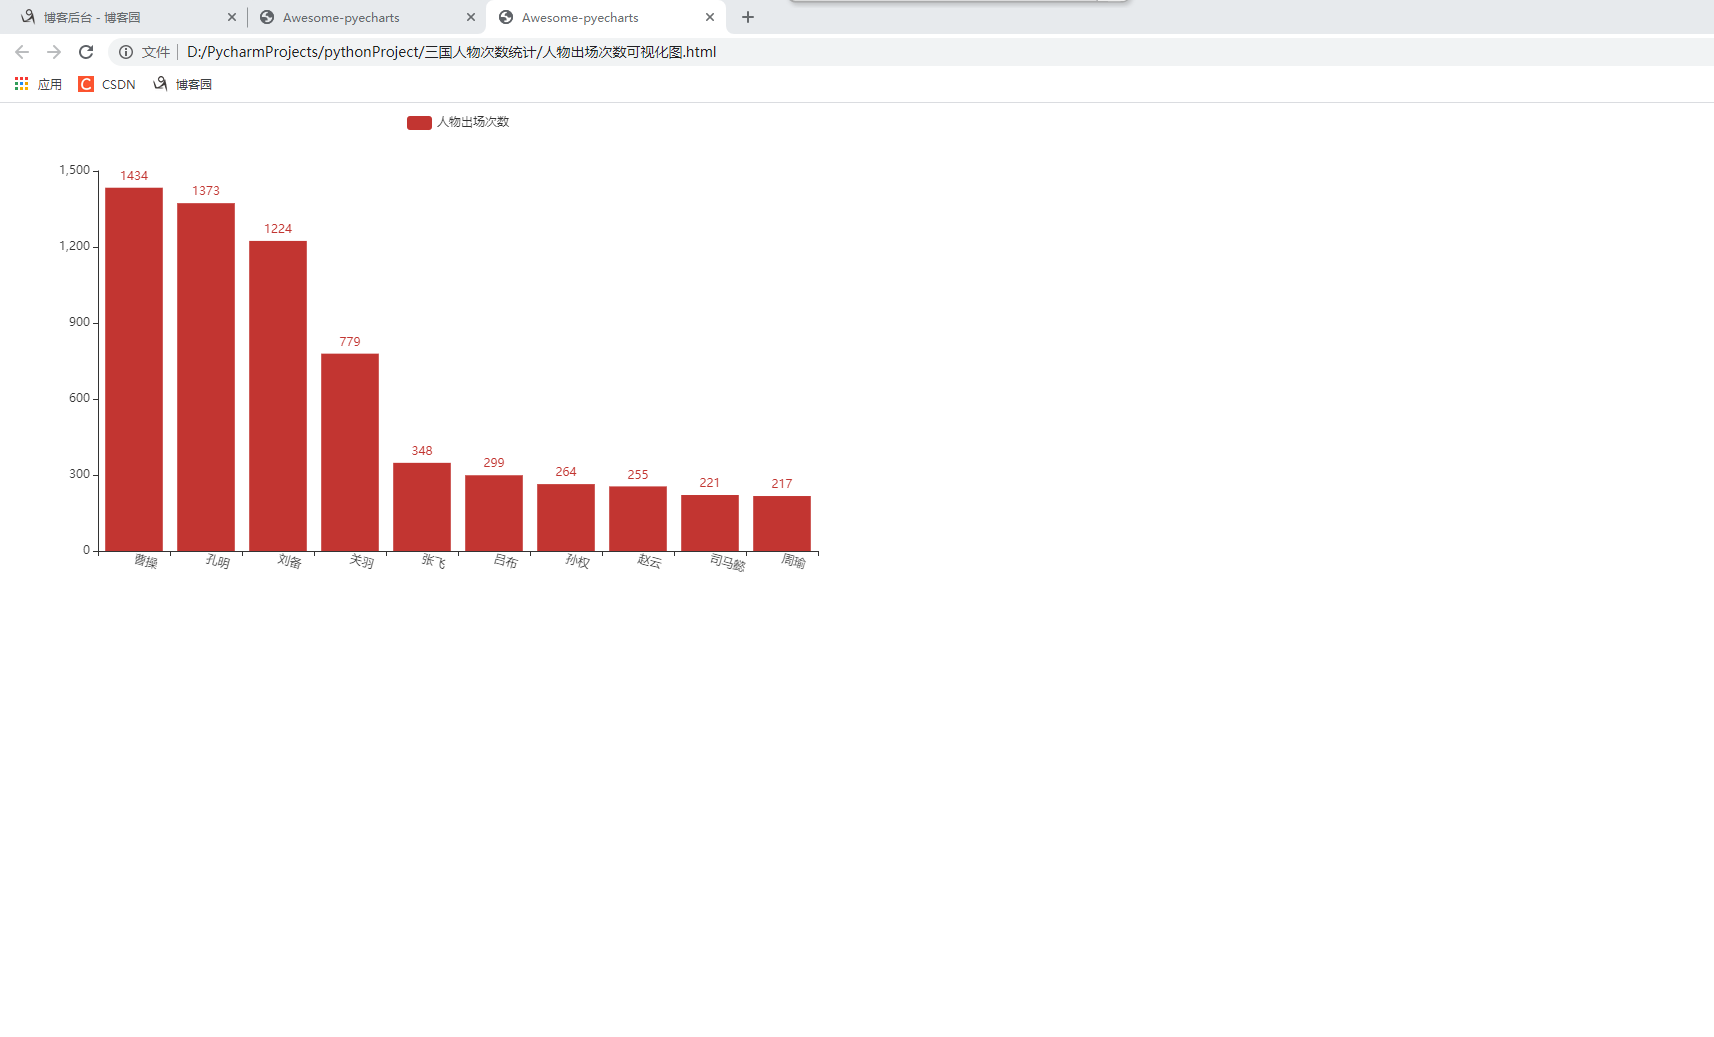
- 執行程式看到目錄下會生成一個名為人物出場次數視覺化圖.html的檔案,如下圖
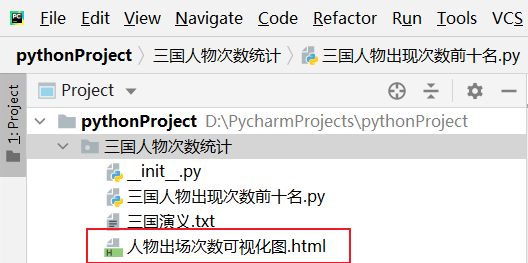
- 使用瀏覽器開啟,就可以看到資料以圖形的方式呈現出來。
# 三、全部程式碼呈現
```Python
#《三國演義》的人物出場次數Python程式碼:
import jieba #匯入庫
import os
from pyecharts import options as opts
from pyecharts.charts import Bar
print("人物出現次數前十名:")
txt = open('三國演義.txt', 'r' ,encoding='gb18030').read()
remove = {"將軍", "卻說", "不能", "後主", "上馬", "不知", "天子", "大叫", "眾將", "不可",
"主公", "蜀兵", "只見", "如何", "商議", "都督", "一人", "漢中", "人馬",
"陛下", "魏兵", "天下", "今日", "左右", "東吳", "於是", "荊州", "不能", "如此",
"大喜", "引兵", "次日", "軍士", "軍馬","二人","不敢"} # 這些文字是要排出掉的,多次執行程式所得到的
words = jieba.lcut(txt)
counts = {}
for word in words:
if len(word) == 1:
continue
elif word == "諸葛亮" or word == "孔明曰":
rword = "孔明"
elif word == "關公" or word == "雲長":
rword = "關羽"
elif word == "玄德" or word == "玄德曰":
rword = "劉備"
elif word == "孟德" or word == "丞相":
rword = "曹操" # 把相同意思的名字歸為一個人
else:
rword = word
counts[rword] = counts.get(rword, 0) + 1
for word in remove:
del counts[word] #匹配文字相等就刪除
items = list(counts.items())
items.sort(key=lambda x: x[1], reverse=True)
#匯出資料
fo = open("三國人物出場次數.txt", "a", encoding='utf-8')
for i in range(10):
word, count=items[i]
word = str(word)
count = str(count)
fo.write(word)
fo.write(':') #使用冒號分開
fo.write(count)
fo.write('\n') #換行
fo.close() #關閉檔案
#將txt文本里的資料轉換為字典形式
fr = open('三國人物出場次數.txt', 'r',encoding='utf-8' )
dic = {}
keys = [] # 用來儲存讀取的順序
for line in fr:
v = line.strip().split(':')
dic[v[0]] = v[1]
keys.append(v[0])
fr.close()
print(dic)
# 繪圖
list1=list(dic.keys())
list2=list(dic.values()) #提取字典裡的資料作為繪圖資料
c = (
Bar()
.add_xaxis(list1)
.add_yaxis("人物出場次數",list2)
.set_global_opts(
xaxis_opts=opts.AxisOpts(axislabel_opts=opts.LabelOpts(rotate=-15)),
)
.render("人物出場次數視覺化圖.html"
