
asp.net core 整合 Prometheus
阿新 • • 發佈:2020-11-28
# asp.net core 整合 prometheus
## Intro
Prometheus 是一個開源的現代化,雲原生的系統監控框架,並且可以輕鬆的整合 PushGateway, AlertManager等元件來豐富它的功能。
對於 k8s 下部署的系統來說使用 Prometheus 來做系統監控會是一個比較不錯的選擇,我們現在正在使用的模式就是應用暴露 metrics 資訊給 Prometheus,然後使用 Grafana 做展示。
## Prometheus
Prometheus 是一套開源的系統監控和報警框架,靈感源自 Google 的 Borgmon 監控系統。
2012年,SoundCloud的 Google 前員工創造了 Prometheus,並作為社群開源專案進行開發。2015年,該專案正式釋出。2016年,Prometheus加入 CNCF 雲原生計算基金會(Cloud Native Computing Foundation),成為受歡迎度僅次於Kubernetes 的專案。
Prometheus 具有以下特性:
多維的資料模型(基於時間序列的Key、Value鍵值對)
靈活的查詢和聚合語言 PromQL
提供本地儲存和分散式儲存
通過基於 HTTP 的 Pull 模型採集時間序列資料
可利用 Pushgateway(Prometheus的可選中介軟體)實現 Push 模式
可通過動態服務發現或靜態配置發現目標機器
支援多種圖表和資料大盤
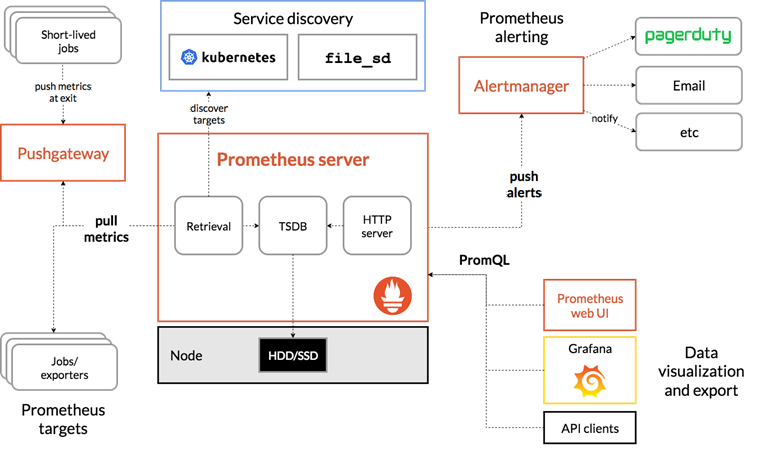
Prometheus 架構圖:
### Metrics Types
Prometheus 支援 4 種 Metrics 型別,分別是 Counter、Gauge、Histogram、Summary
- Counter:計數器,單調遞增,應用啟動之後只會增加不會減少
- Gauge:儀表,和 Counter 類似,可增可減
- Histogram:直方圖,柱形圖,Histogram其實是**一組資料**,主要用於統計資料分佈的情況 —— 統計落在某些值的範圍內的計數,同時也提供了所有值的總和和個數
- Summary:彙總,摘要,summary 類似於 histogram,也是一組資料。不同的是,它統計的不是區間的個數而是統計分位數。
具體可以參考官方文件的介紹:[https://prometheus.io/docs/concepts/metric_types](https://prometheus.io/docs/concepts/metric_types/)
### Metrics 格式
metrics_name{=...} metrics_value
舉個例子:
`dotnet_collection_count_total{generation="1"} 3`
metrics_name 是 `dotnet_collection_count_total`,metrics 的值是 3,這個 metrics 有一個 label, 名稱是 `generation`,值是 1
## asp.net core 整合 prometheus-dotnet
在 dotnet 中可以使用 `prometheus-dotnet`/`AppMetrics`/`Prometheus.Client` 等來實現和 Prometheus 的整合,目前比較活躍的,用的比較多的是 `prometheus-dotnet` 這個庫,很多 prometheus 的擴充套件都是基於這個庫的,prometheus 預設已經集成了很多 metrics ,所以可以通過一些簡單的配置就可以獲取到很多有用的 metrcis 資訊,後面對於支援的 metrics 做了一個彙總
安裝 nuget 包
``` bash
dotnet add package prometheus-dotnet.AspNetCore
```
註冊 endpoint 路由,新版本的 `prometheus-dotnet.AspNetCore` 使用 endpoint 路由的方式來註冊 Prometheus 的 metrics
``` csharp
app.UseEndpoints(endpoints =>
{
// 註冊 metrics 路由,預設 metrics 輸出路徑是 /metrics,如果有衝突可以指定一個 path 引數
endpoints.MapMetrics();
endpoints.MapControllers();
});
```
如果不需要統計 HttpRequest 的資訊,這樣就已經足夠了,如果要統計 HttpRequest 的處理資訊,需要在 `UseRounting` 之後註冊 `UseHttpMetrics` 中介軟體
HttpMetrics 預設會增加三種 metrics,一個是處理的請求數量,一個是正在處理的請求數量,還有一個是請求處理耗時的一個統計,如果要禁用某一種 metrics,可以傳入一個 `Options` 或者通過委託配置 `Enabled`
``` csharp
app.UseHttpMetrics(options=>
{
options.RequestCount.Enabled = false;
});
```
配置好之後可以在 `/metrics` 路徑上看到類似下圖的 metrics 輸出就證明正常工作了
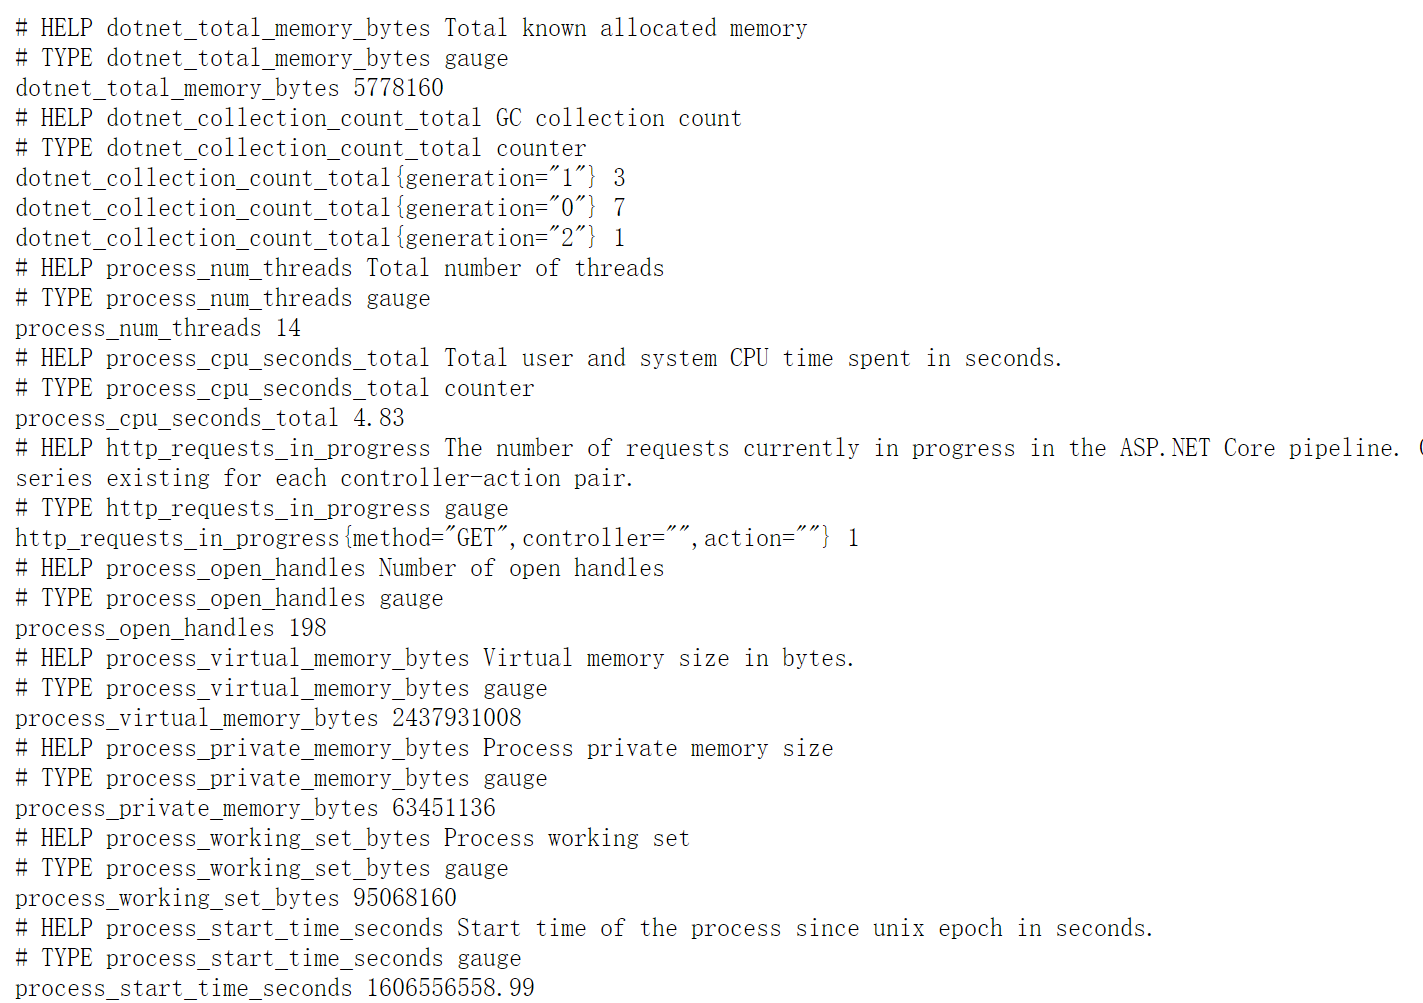
輸出 metrics 的格式如下:
```
# HELP dotnet_total_memory_bytes Total known allocated memory
# TYPE dotnet_total_memory_bytes gauge
dotnet_total_memory_bytes 6184632
```
第一行表示這個 metrics 對應的 description,大概介紹
第二行表示這個 metrics 對應的型別
第三行後面的表示 metrics 的資料
## Metrics
### prometheus-dotnet Stats
| metrics mame | Description | Get Method | Metric Type |
| ----------------------------- | --------------------------------------------- | ------------------------------------------------------------ | ----------- |
| dotnet_collection_count_total | 每一代 GC 垃圾回收的次數,可以通過 label 區分 | `GC.CollectionCount(gen)` | Counter |
| process_start_time_seconds | 程序的啟動時間 | `(process.StartTime.ToUniversalTime() - epoch).TotalSeconds` | Gauge |
| process_cpu_seconds_total | 程序使用的 CPU 時間 | `process.TotalProcessorTime.TotalSeconds` | Counter |
| process_virtual_memory_bytes | 程序佔用的虛擬記憶體,單位是 byte | `process.VirtualMemorySize64` | Gauge |
| process_working_set_bytes | 程序佔用的實體記憶體,單位是 byte | `process.WorkingSet64` | Gauge |
| process_private_memory_bytes | 程序佔用的私有實體記憶體,單位是 byte | `process.PrivateMemorySize64` | Gauge |
| process_open_handles | 程序開啟的控制代碼數 | `process.HandleCount` | Gauge |
| process_num_threads | 程序內執行緒數量(作業系統執行緒數量) | `process.Threads.Count` | Gauge |
| dotnet_total_memory_bytes | GC 已分配的記憶體,單位是 byte | `GC.GetTotalMemory(false)` | Gauge |
### ASP.NET CORE Stats
| Name | Description | Type |
| ----------------------------- | ------------------------------ | --------- |
| http_requests_in_progress | 正在處理的 HTTP 請求 | Gauge |
| http_requests_received_total | 應用啟動後處理的 HTTP 請求總數 | Counter |
| http_request_duration_seconds | HTTP 請求處理時間 | Histogram |
## Prometheus 整合
在前面我們已經在應用中輸出了 metrics,下一步就是把 Metrics 整合到 prometheus 裡去
首先我們需要安裝 Prometheus,從官網下載 Prometheus,下載之後解壓到一個目錄下面,修改配置檔案新增一個 job 來抓取應用中的 metrics 資訊:
開啟 `prometheus.yml` 檔案,在 `scrape_configs` 中新增 `job` 配置來抓取應用中的 Metrics,詳細的配置引數可以參考 Prometheus 文件
-
-
-
-