[C#] 老古董的 Microsoft Chart Controls 也可以進行資料預測
阿新 • • 發佈:2021-01-13
我要先宣告,這篇文章介紹到的內容雖說不是不能用,但玩樂成分居多,大家看看就好,不要太認真。
## 1. Microsoft Chart Controls 中的 FinancialFormula
在上一篇文章 [使用 Math.Net 進行曲線擬合和資料預測](https://www.cnblogs.com/dino623/p/curve_fitting_and_data_prediction_using_math_net.html) 中,我介紹瞭如何使用 [Math.Net](https://www.mathdotnet.com/) ,這篇文章玩玩“新”花樣,用古老的 Microsoft Chart Controls 實現相同的功能。
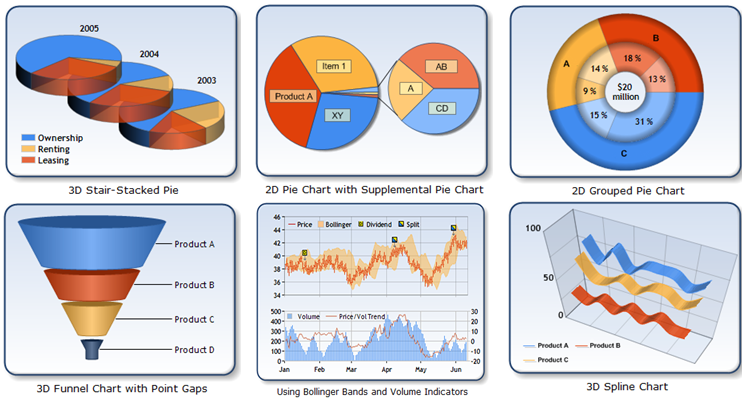
A long time ago in a galaxy far, far away... 微軟推出了一套免費又強大的圖表控制元件,它用於 WinForms 和 WebForms 中,可輕鬆套用各種功能強大的 2D、3D、實時變化的動態圖表,頭髮比較少的 .NET 開發者或多或少都接觸過這套圖表控制元件。雖然現在看來多少有些落後了,但它還是很有用啊,而且還不收錢。

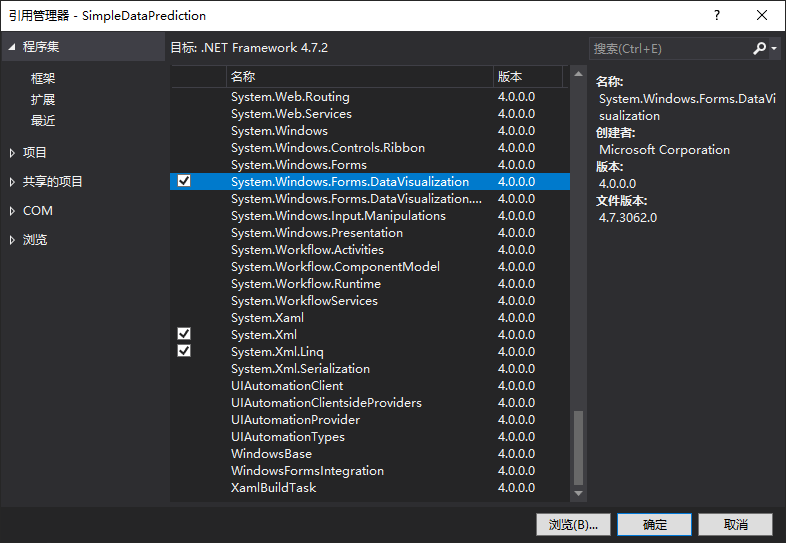
那麼,在哪裡可以找到這個圖表庫呢?現在微軟的官網也只能找到 for Microsoft .NET Framework 3.5 的[下載](https://www.microsoft.com/en-us/download/details.aspx?id=14422),找不到更新的版本。幸好 Visual Studio 裡就自帶了這個圖示庫,可以直接新增 `System.Windows.Forms.DataVisualization` 的引用:
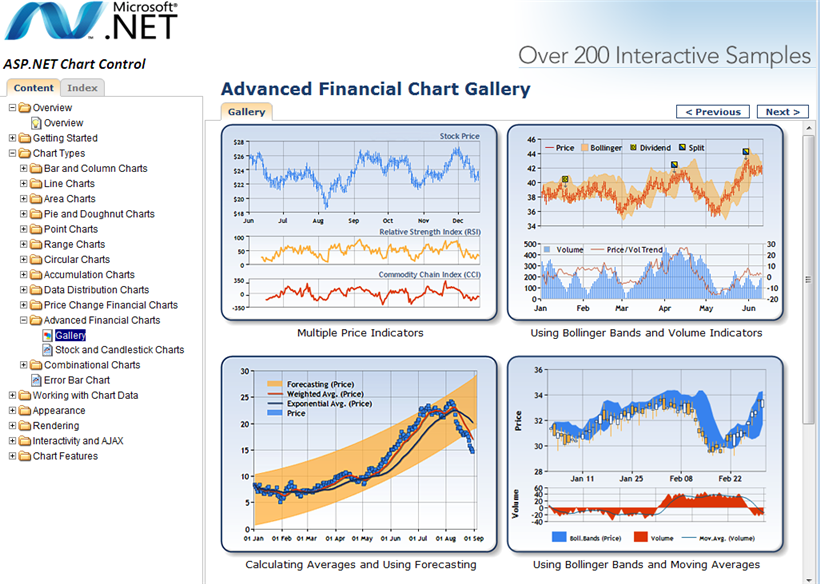
這篇我不會介紹如何做圖表,而是講講這個圖示庫中的一樣很有趣的東西:[FinancialFormula](https://docs.microsoft.com/zh-cn/dotnet/api/system.windows.forms.datavisualization.charting.dataformula.financialformula?view=netframework-4.8&WT.mc_id=WD-MVP-5003763)。如果只是做簡單的財務資料處理,可以用它玩玩。當圖表中已有其它序列(Series)的資料,DataManipulator 的 `FinancialFormula` 可以使用大部分常見的金融公式處理這些資料併產生新的資料序列。
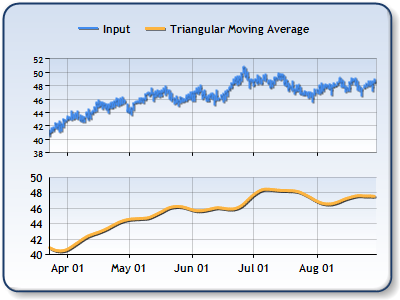
例指,`數移動平均線 `(Exponential Moving Average) 是對一段時間內的資料計算所得的平均值,它的輸入和輸出如下:
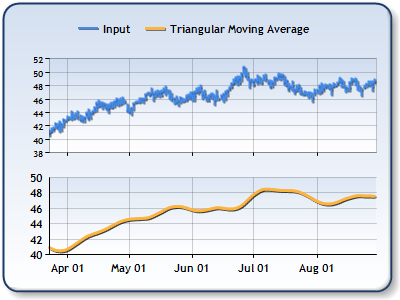
而`蔡金震盪` (Chaikin Oscillator) 指標是指應用於聚散的 3 天指數移動平均線與 10 天指數移動平均線之差,它的輸出如下:
FinancialFormula 還有很多其它用法,具體可以參考以下兩個頁面:
[FinancialFormula Enum (System.Windows.Forms.DataVisualization.Charting) Microsoft Docs](https://docs.microsoft.com/zh-cn/dotnet/api/system.windows.forms.datavisualization.charting.financialformula?view=netframework-4.8&WT.mc_id=WD-MVP-5003763)
[Using Financial Formulas](https://origin2.cdn.componentsource.com/sites/default/files/resources/dundas/538236/WinChart2005/Formulas_HowToUseFormulas.html)
## 2. 資料預測
這次我用到的是`預測` (Forecasting) ,它是指使用歷史觀測值來預測未來值。
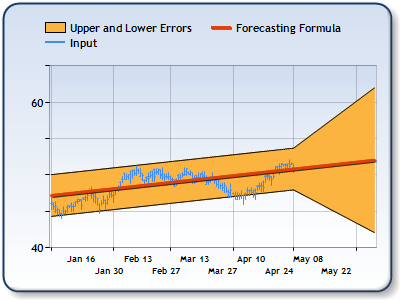
Forecasting公式採用四個可選引數:
- **RegressionType**: 迴歸型別。使用一個數字來指示特定次數的多元迴歸,或者使用以下值之一指定不同的迴歸型別:Linear、Exponential、Logarithmic、Power。預設值為 2,與指定 Linear 等效。
- **Period**: 預測時段。公式會預測此指定的未來天數內的資料變化。預設值為序列長度的一半。
- **ApproxError**: 是否輸出近似誤差。如果設定為 false,則輸出誤差序列不包含相應歷史資料的資料。預設值為 true。
- **ForecastError**: 是否輸出預測誤差。如果設定為 false,並且 ApproxError 設定為 true,則輸出誤差序列將包含所有預測資料點的近似誤差。預設值為 true。
輸出值有三個序列:
- **Forecast**: 預測測值。
- **UpperError**: 上限誤差。
- **LowerError**: 下限誤差。
輸入引數中迴歸型別的具體值所代表的公式可以參考以下連結:
[Time Series and Forecasting Formula](https://origin2.cdn.componentsource.com/sites/default/files/resources/dundas/538236/WinChart2005/Forecasting.html)
使用 `FinancialFormula` 的程式碼十分簡單,只需建立一個臨時的 `Chart` ,插入原始資料作為一個 `Series` ,然後呼叫 `DataManipulator.FinancialFormula` 即可,所有程式碼加起來也就 30 來行:
``` CS
public double[] GetPredictData(int forecastingPoints, double[] points)
{
var tempChart = new Chart();
tempChart.ChartAreas.Add(new ChartArea());
tempChart.ChartAreas[0].AxisX = new Axis();
tempChart.ChartAreas[0].AxisY = new Axis();
tempChart.Series.Add(new Series());
for (int i = 0; i < points.Length; i++)
{
tempChart.Series[0].Points.AddXY(i, points[i]);
}
var trendSeries = new Series();
tempChart.Series.Add(trendSeries);
var typeRegression = "Exponential";
var forecasting = forecastingPoints.ToString();
var error = "false";
var forecastingError = "false";
var parameters = typeRegression + ',' + forecasting + ',' + error + ',' + forecastingError;
tempChart.DataManipulator.FinancialFormula(FinancialFormula.Forecasting, parameters, tempChart.Series[0], trendSeries);
var result = new List();
for (int i = 0; i < trendSeries.Points.Count; i++)
{
result.Add(trendSeries.Points[i].YValues[0]);
}
return result.ToArray();
}
```
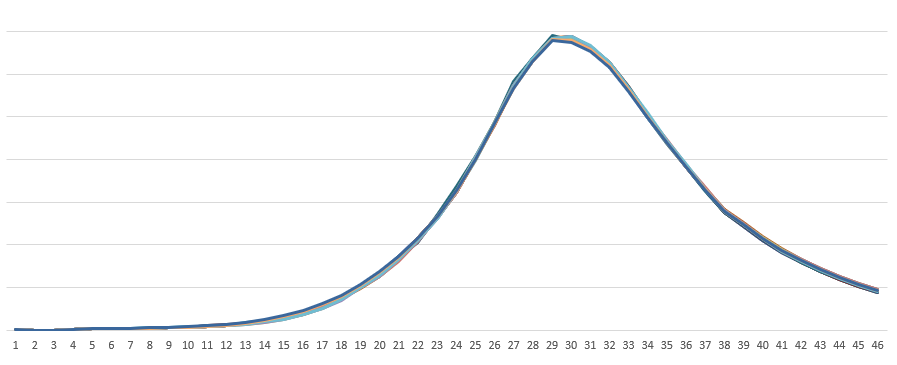
這裡我使用了 `Exponential` (指數函式)作為迴歸型別,結果如下,看起來重複性很好,但是轉折處比較生硬,導致最後在實際計算中不太理想。如果想要理想的結果,應該先嚐試找出最合適的迴歸公式。
## 3. 最後
`FinancialFormula` 挺好玩的,但它和圖表控制元件耦合在一起,用起來感覺有點邪門歪道,倒是通過它多少學會了一點財務公式。
話說回來當年微軟的控制元件庫都很上心嘛,現在微軟都不會出這麼良心的圖表庫了,逼我們買第三方控制元件。
## 4.參考
[Time Series and Forecasting Formula](https://origin2.cdn.componentsource.com/sites/default/files/resources/dundas/538236/WinChart2005/Forecasting.html)
[DataManipulator Class (System.Web.UI.DataVisualization.Charting) Microsoft Docs](https://docs.microsoft.com/zh-cn/dotnet/api/system.web.ui.datavisualization.charting.datamanipulator?view=netframework-4.8&WT.mc_id=WD-MVP-5003763)
[DataFormula.FinancialFormula Method (System.Windows.Forms.DataVisualization.Charting) Microsoft Docs](https://docs.microsoft.com/zh-cn/dotnet/api/system.windows.forms.datavisualization.charting.dataformula.financialformula?view=netframework-4.8&WT.mc_id=WD-MVP-5003763)
[FinancialFormula Enum (System.Windows.Forms.DataVisualization.Charting) Microsoft Docs](https://docs.microsoft.com/zh-cn/dotnet/api/system.windows.forms.datavisualization.charting.financialformula?view=netframework-4.8&WT.mc_id=WD-MVP-5003763)
[how to generate graphs using Microsoft Chart Control ](http://www.nullskull.com/q/10352018/how-to-generate-graphs-using-microsoft-chart-control.aspx)
## 5. 原始碼
