
使用Prometheus搞定微服務監控
阿新 • • 發佈:2021-03-01
最近對服務進行監控,而當前監控最流行的資料庫就是 `Prometheus`,同時 `go-zero` 預設接入也是這款資料庫。今天就對 `go-zero` 是如何接入 `Prometheus` ,以及開發者如何自己定義自己監控指標。
## 監控接入
`go-zero` 框架中集成了基於 `prometheus` 的服務指標監控。但是沒有顯式開啟,需要開發者在 `config.yaml` 中配置:
```yaml
Prometheus:
Host: 127.0.0.1
Port: 9091
Path: /metrics
```
如果開發者是在本地搭建 `Prometheus`,需要在 `Prometheus` 的配置檔案 `prometheus.yaml` 中寫入需要收集服務監控資訊的配置:
```yaml
- job_name: 'file_ds'
static_configs:
- targets: ['your-local-ip:9091']
labels:
job: activeuser
app: activeuser-api
env: dev
instance: your-local-ip:service-port
```
因為本地是用 `docker` 執行的。將 `prometheus.yaml` 放置在 `docker-prometheus` 目錄下:
```shell
docker run \
-p 9090:9090 \
-v dockeryml/docker-prometheus:/etc/prometheus \
prom/prometheus
```
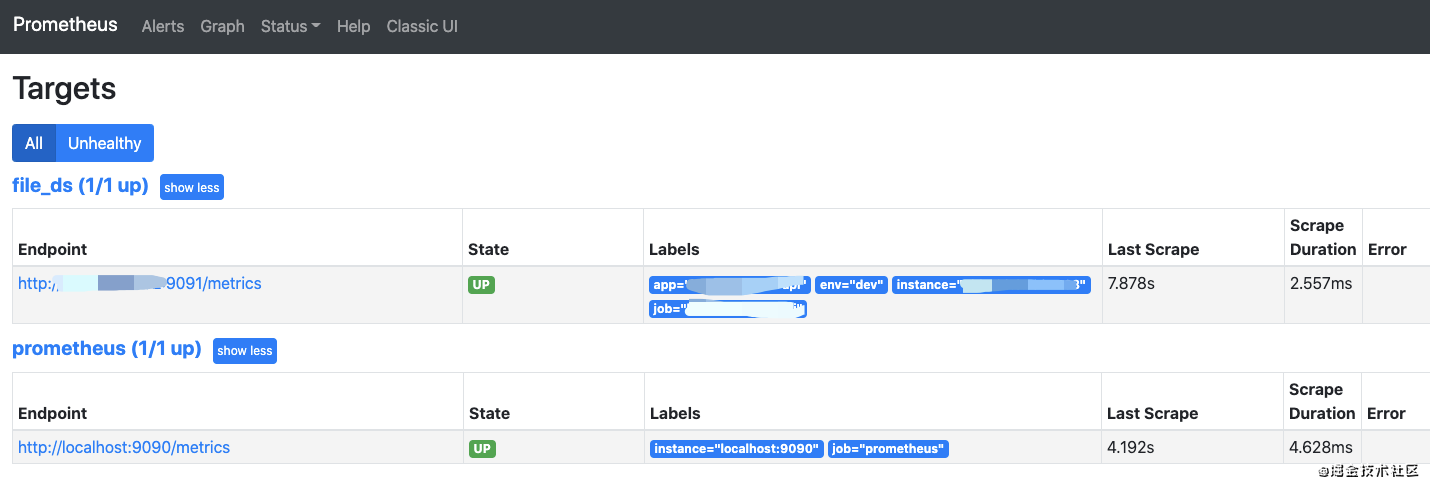
開啟 `localhost:9090` 就可以看到:
點選 `http://service-ip:9091/metrics` 就可以看到該服務的監控資訊:
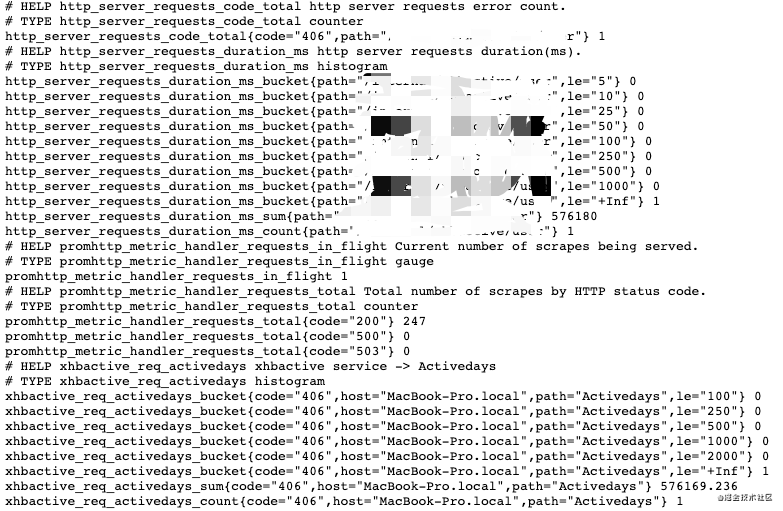
上圖我們可以看出有兩種 `bucket`,以及 `count/sum` 指標。
那 `go-zero` 是如何整合監控指標?監控的又是什麼指標?我們如何定義我們自己的指標?下面就來解釋這些問題
> 以上的基本接入,可以參看我們的另外一篇:https://zeromicro.github.io/go-zero/service-monitor.html
## 如何整合
上面例子中的請求方式是 `HTTP`,也就是在請求服務端時,監控指標資料不斷被蒐集。很容易想到是 **中介軟體** 的功能,具體程式碼:https://github.com/tal-tech/go-zero/blob/master/rest/handler/prometheushandler.go。
```go
var (
metricServerReqDur = metric.NewHistogramVec(&metric.HistogramVecOpts{
...
// 監控指標
Labels: []string{"path"},
// 直方圖分佈中,統計的桶
Buckets: []float64{5, 10, 25, 50, 100, 250, 500, 1000},
})
metricServerReqCodeTotal = metric.NewCounterVec(&metric.CounterVecOpts{
...
// 監控指標:直接在記錄指標 incr() 即可
Labels: []string{"path", "code"},
})
)
func PromethousHandler(path string) func(http.Handler) http.Handler {
return func(next http.Handler) http.Handler {
return http.HandlerFunc(func(w http.ResponseWriter, r *http.Request) {
// 請求進入的時間
startTime := timex.Now()
cw := &security.WithCodeResponseWriter{Writer: w}
defer func() {
// 請求返回的時間
metricServerReqDur.Observe(int64(timex.Since(startTime)/time.Millisecond), path)
metricServerReqCodeTotal.Inc(path, strconv.Itoa(cw.Code))
}()
// 中介軟體放行,執行完後續中介軟體和業務邏輯。重新回到這,做一個完整請求的指標上報
// [