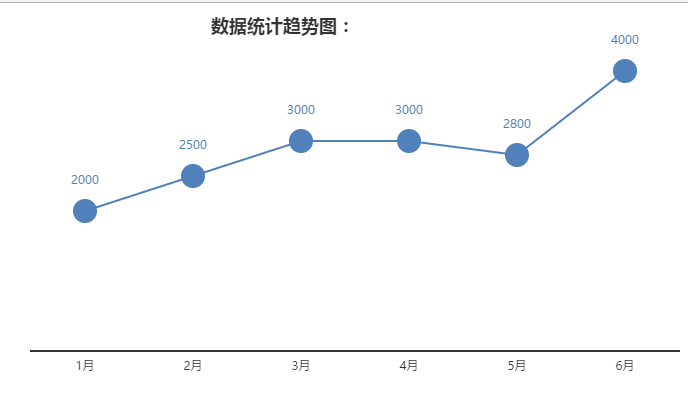
Echart 使用圖表簡單示例
阿新 • • 發佈:2017-06-26
har echarts 網格 ntb rip common 圖表 技術分享 nes
簡單應用方式:
<div id="main"></div>
引用Echart
<script src="js/echarts.common.min.js"></script>
var myChart = echarts.init(document.getElementById(‘main‘));
     option={

          ...配置項

      }
myChart.setOption(option);
配置項設置:
//兩邊留白:
boundaryGap:[‘30%‘, ‘30%‘]
//不要刻度線:
axisTick:{
    show:false
},
//設置軸線線寬:
axisLine:{
    lineStyle:{
        width:2
    }
}
//不要網格:
grid:{
    show:false,
}
//Y軸軸線不顯示
yAxis : [
    {
        show:false,
    }
//數據結果設置
series : [
    {
        type:‘line‘,
        symbol:‘circle‘,//拐點的形狀 實心圓
        symbolSize:24,//拐點的形狀的大小
        label:{
            normal:{
                show:true,
                // offset:[0,-10],
                textStyle:{
                    color:"#5181bb",//提示值的字體顏色設置
                }
            }
        },
        itemStyle:{
            normal:{
                color:"#5181bb"
            }
        },
        data:[10, 50, 80, 100, 150, 60],//數據
    }
]

]


更多配置參考 :http://echarts.baidu.com/option.html#xAxis.nameGap
Echart 使用圖表簡單示例
