
How to monitor mongodb replica set using prometheu
阿新 • • 發佈:2018-07-08
global rom dash off afa nload .com fir ash How to monitor mongodb replica set using prometheus
監控mongodb replica set其實有很多方式:
- Using zabbix template to view mongodb data(zabbix+grafana)
- Mongodb官方自己的,不過現在收費了
- Prometheus通過mongodb-exporter收集數據,然後使用Grafana展示數據(prometheus+grafana)
- etc...
Install prometheus
- See detail from official: https://prometheus.io/docs/introduction/first_steps/
- How to install prometheus on docker on ubuntu14.04: https://www.digitalocean.com/community/tutorials/how-to-install-prometheus-using-docker-on-ubuntu-14-04
- pull docker images from: https://store.docker.com/community/images/prom/prometheus
simple configure file
?  prometheus-2.3.1.linux-amd64 cat prometheus.yml|awk ‘{if($0 !~ /^$/ && $0 !~ /^#/) {print $0}}‘
global:
  scrape_interval:     15s # Set the scrape interval to every 15 seconds. Default is every 1 minute.
  evaluation_interval: 15s # Evaluate rules every 15 seconds. The default is every 1 minute.
  # scrape_timeout is set to the global default (10s).
alerting:
  alertmanagers:
  - static_configs:
    - targets:
      # - alertmanager:9093
rule_files:
  # - "first_rules.yml"
  # - "second_rules.yml"
scrape_configs:
  # The job name is added as a label `job=<job_name>` to any timeseries scraped from this config.
  - job_name: ‘prometheus‘
    # metrics_path defaults to ‘/metrics‘
    # scheme defaults to ‘http‘.
    static_configs:
    - targets: [‘localhost:9090‘]
  - job_name: ‘node-exporter‘
    static_configs:
    - targets: [‘localhost:9100‘]
  - job_name: ‘mongodb-exporter‘
    static_configs:
    - targets: [‘localhost:9001‘]
Install Node-exporter
- exporters and intergrations: https://prometheus.io/docs/instrumenting/exporters/
Install mongodb-exporter
- exporters and intergrations: https://prometheus.io/docs/instrumenting/exporters/
- mongodb-exporter: https://github.com/dcu/mongodb_exporter
- download mongodb-exporter release: https://github.com/dcu/mongodb_exporter/releases/download/v1.0.0/mongodb_exporter-linux-amd64
run mongodb-exporter
?  prometheus ./mongodb_exporter -mongodb.uri mongodb://192.168.152.128:27017,192.168.152.128:27018,192.168.152.128:27019
Listening on :9001 (scheme=HTTP, secured=no, clientValidation=no)
you also can run the multi MongoDB-exporter process to get the metrics of simple MongoDB instance. if so. you should add multi job_name in prometheus.yml. you can monitor every simple MongoDB instance details in grafana by setting dashboard variables.
Insatll Grafana
- see official docs: http://docs.grafana.org/installation/debian/
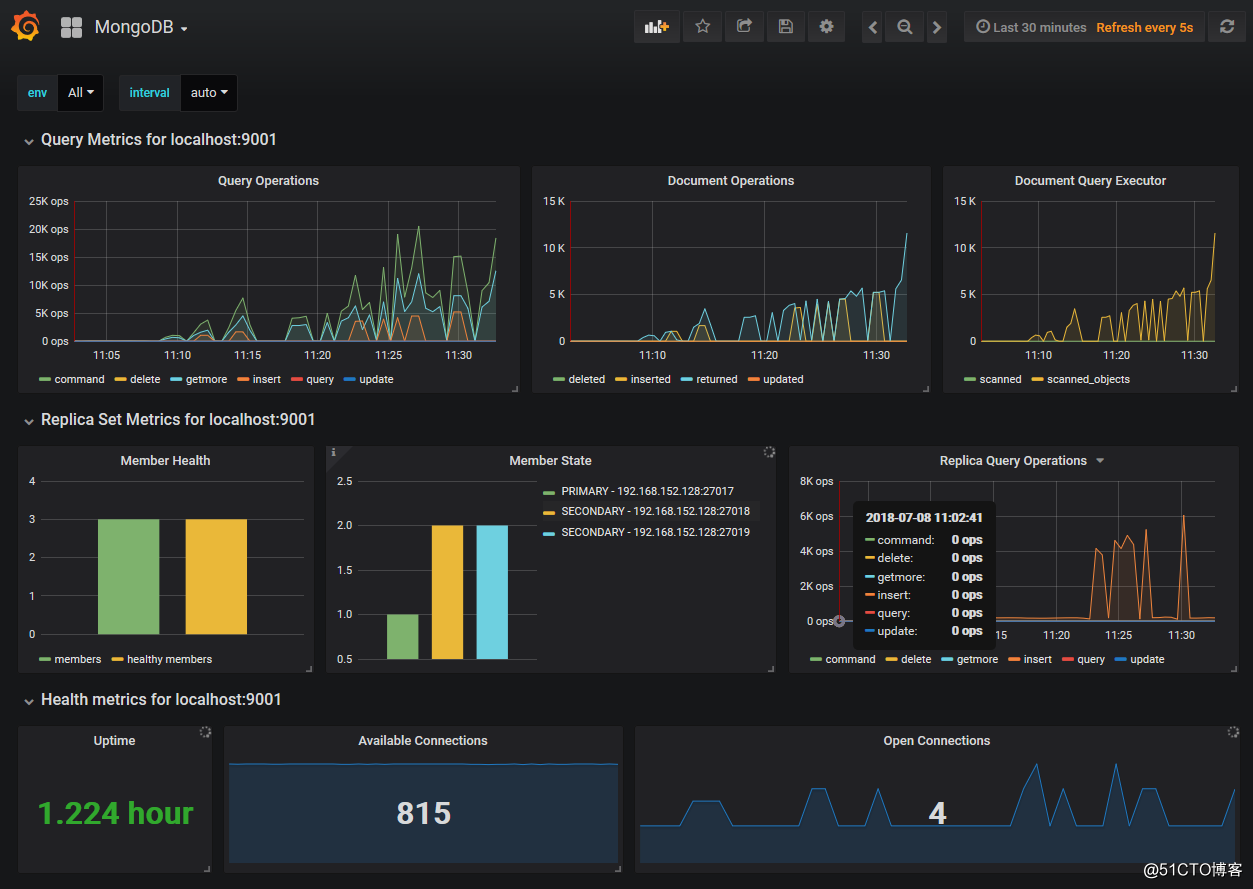
Configure DashBoard
- download grafana dashboard template json file: https://grafana.com/api/dashboards/2583/revisions/2/download
How to monitor mongodb replica set using prometheu