威斯康星乳腺癌良性預測
阿新 • • 發佈:2018-11-01
一、獲取資料
wget https://archive.ics.uci.edu/ml/machine-learning-databases/breast-cancer-wisconsin/breast-cancer-wisconsin.data
原始資料以逗號分隔:
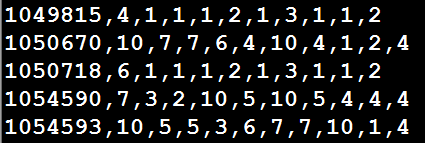
各個列的屬性:
1.Sample Code Number id number
2.Clump Thickness 1 - 10 腫塊厚度
3.Uniformity Of Cell Size 1 - 10 細胞大小均一性
4.Uniformity Of Cell Shape 1 - 10 細胞形狀的均一性
5.Marginal Adhesion 1 - 10 邊緣附著性
6.Single Epithelial Cell Size 1 - 10 單上皮細胞大小
7.Bare Nuclei 1 - 10 裸核
8.Bland Chromatin 1 - 10 布蘭染色質
9.Normal Nucleoli 1 - 10 正常核仁
10.Mitoses 1 - 10 有絲分裂
11.Class 2是良性,4是惡性
二、使用LR和SGD
import pandas as pd
import numpy as np
from sklearn.model_selection import train_test_split
from sklearn.preprocessing import StandardScaler
from sklearn.linear_model import LogisticRegression
from sklearn.linear_model import SGDClassifier
from sklearn import metrics
#資料沒有標題,因此加上引數header
data = pd.read_csv('https://archive.ics.uci.edu/ml/machine-learning-databases/breast-cancer-wisconsin/breast-cancer-wisconsin.data', header=None)
column_names = ['Sample code number','Clump Thickness','Uniformity of Cell Size','Uniformity of Cell Shape',\
'Marginal Adhesion','Single Epithelial Cell Size','Bare Nuclei',\
'Bland Chromatin','Normal Nucleoli','Mitoses','Class']
data.columns = column_names
#發現數據中存在?符號
data = data.replace(to_replace='?',value = np.nan)
data = data.dropna(how='any')
#一般1代表惡性,0代表良性(本資料集4惡性,所以將4變成1,將2變成0)
#data['Class'][data['Class'] == 4] = 1
#data['Class'][data['Class'] == 2] = 0
data.loc[data['Class'] == 4, 'Class'] = 1
data.loc[data['Class'] == 2, 'Class'] = 0
#Sample code number特徵對分類沒有作用,將資料集75%作為訓練集,25%作為測試集
X_train, X_test, y_train, y_test = train_test_split(data[ column_names[1:10] ], data[ column_names[10] ], test_size = 0.25, random_state = 33)
ss = StandardScaler()
X_train = ss.fit_transform(X_train)
X_test = ss.transform(X_test)
lr = LogisticRegression()
lr.fit(X_train, y_train)
lr_y_predict = lr.predict(X_test)
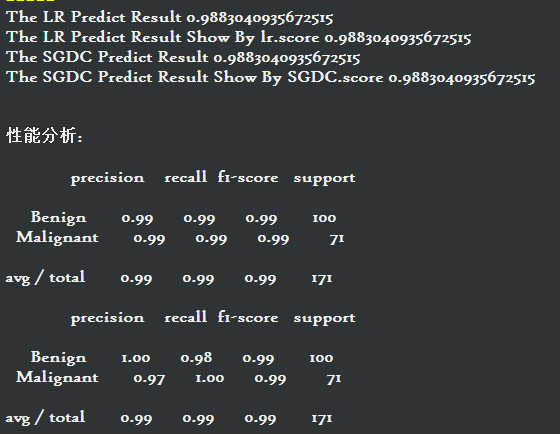
print( 'The LR Predict Result', metrics.accuracy_score(lr_y_predict, y_test) )
#LR也自帶了score
print( "The LR Predict Result Show By lr.score", lr.score(X_test, y_test) )
sgdc = SGDClassifier(max_iter = 1000)
sgdc.fit(X_train, y_train)
sgdc_y_predict = sgdc.predict(X_test)
print( "The SGDC Predict Result", metrics.accuracy_score(sgdc_y_predict, y_test) )
#SGDC也自帶了score
print( "The SGDC Predict Result Show By SGDC.score", sgdc.score(X_test, y_test) )
print("\n")
print("效能分析:\n")
#效能分析
from sklearn.metrics import classification_report
#使用classification_report模組獲得LR三個指標的結果(召回率,精確率,調和平均數)
print( classification_report( y_test,lr_y_predict,target_names=['Benign','Malignant'] ) )
##使用classification_report模組獲得SGDC三個指標的結果
print( classification_report( y_test,sgdc_y_predict,target_names=['Benign','Malignant'] ) )
'''
特點分析:
LR對引數的計算採用精確解析的方法,計算時間長但是模型效能高
SGDC採用隨機梯度上升演算法估計模型引數,計算時間短但產出的模型效能略低,
一般而言,對於訓練資料規模在10萬量級以上的資料,考慮到時間的耗用,推薦使用SGDC
'''