python plt視覺化——列印特殊符號和製作圖例
阿新 • • 發佈:2018-11-07
1、列印特殊符號
matplotlib在公式書寫上面跟latex很相似,接下來我們就特殊符號,上標下標來具體展示一下。
import matplotlib.pyplot as plt

x = [i+1 for i in range(20)]
y = x
plt.figure()
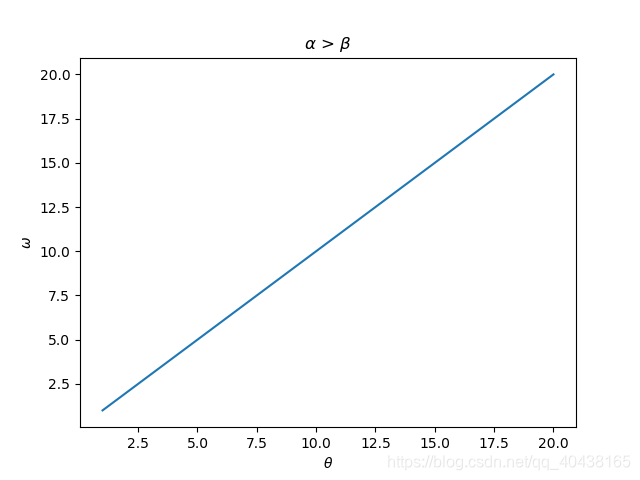
plt.title(r'$\alpha$ > $\beta$')  # 列印α>β
plt.xlabel(r'$\theta$')  # 列印θ
plt.ylabel(r'$\omega$')  # 列印ω
plt.plot(x, y)
plt.show()
效果如下:

由此可見,列印特殊符號需要知道特殊符號的英文名稱,在前面加上轉義符反斜槓,再用一對美元符號包起來即可。
接下來,我們嘗試列印下標和上標。下標需要加"_",上標需要加"^",這跟latex語法完全一樣。
import matplotlib.pyplot as plt

x = [i+1 for i in range(20)]
y = x
plt.figure()
plt.title(r'$\alpha_i$ > $\beta_i$')  # 列印α_i > β_i
plt.xlabel(r'$\theta^2$')  # 列印θ^2
plt.ylabel(r'$\omega^n$')  # 列印ω^n
plt.plot(x, y)
plt.show()
我們看看效果:

更多符號對應字母請見下圖:
2、製作圖例,legend函式
import matplotlib.pyplot as plt
from math import sin, cos, exp

x = [(i+1)/100 for i in range(1000)]
y1 = [sin(i) for i in x]
y2 = [cos(i) for i in x]
y3 = [exp(-i) for i in x]

plt.figure()
plt.plot(x, y1)
plt.plot(x, y2)
plt.plot(x, y3)

# 分別對應y1,y2,y3標誌圖例,注意e^(-x)要加大括號表示(-x)是一個整體,都是上標
plt.legend(['sin(x)', 'cos(x)', '$e^{-x}$'])
plt.show()

在文章最後附上參考連結~
https://matplotlib.org/users/mathtext.html

