
Echarts漂亮水滴圖
ECharts提供了水滴圖外掛
echarts-liquidfill, from @Ovilia
在學習Echarts的時候看到了一款非常漂亮的圖形liquidfill,記錄了Echarts-liquid的各種用法例項

1.使用
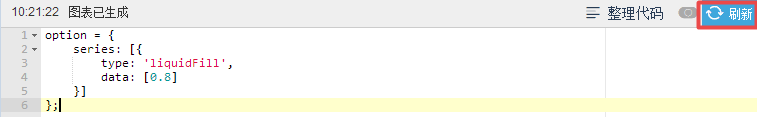
最方便的使用,直接開啟一個Echarts官方編輯器,直接編輯對應的配置項來使用:
修改後點選重新整理即可。
Tips:執行編輯器需要新增指令碼,推薦:
https://rawgit.com/ecomfe/echarts-liquidfill/master/dist/echarts-liquidfill.js
http://echarts.baidu.com/resource/echarts-liquidfill-latest/dist/echarts-liquidfill.js
http://echarts.baidu.com/resource/echarts-liquidfill-latest/dist/echarts-liquidfill.min.js

如果在原始碼中使用,則需要引入指令碼:
<script src='echarts.js'></script>
<script src='echarts-liquidfill.js'></script>
還可以使用npm安轉npm install echarts-liquidfill
或者在直接下載js檔案https://github.com/ecomfe/echarts-liquidfill/tree/master/dist
2.例子
2.1 畫一個水球圖
//首先來畫一個簡單的水球
//開啟編輯器:http://gallery.echartsjs.com/editor.html?c=xVlco1f7mU
option = {
    series: [{
        type: 'liquidFill',
        data: [0.6]
    }]
};
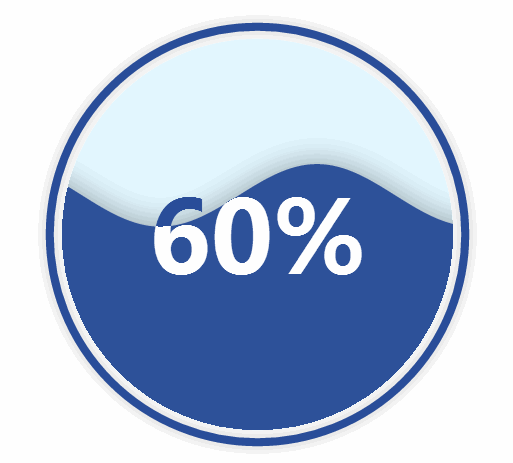
嗯嗯,有些樣子了,但是如果覺得字型不合適,背景也是灰色的,可以調整一下
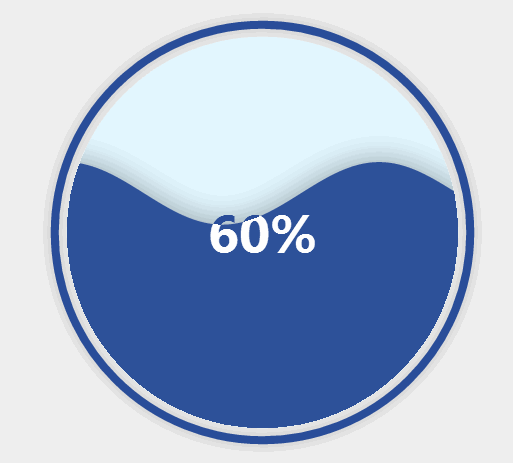
//首先使用background來修改整體的圖背景
option = {
backgroundColor:'white', //調整下整體的背景
修改下字型的大小:
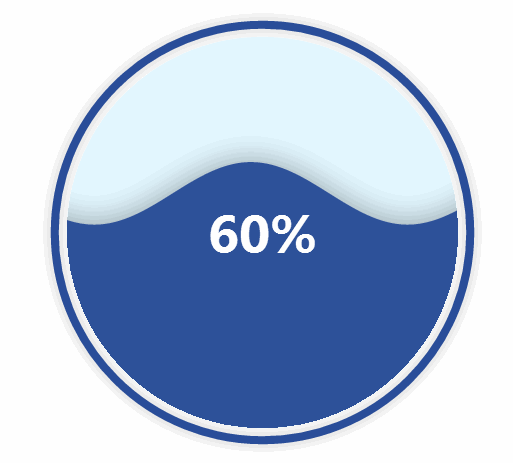
option = {
    backgroundColor:'white',
    series: [{
        type: 'liquidFill',
        data: [0.6],
        label:{
            normal:{
            	//fontSize:80    //這裡也可以設定
                textStyle:{
                    fontSize:80  //修改字型大小
                }
            }
        }
    }]
};
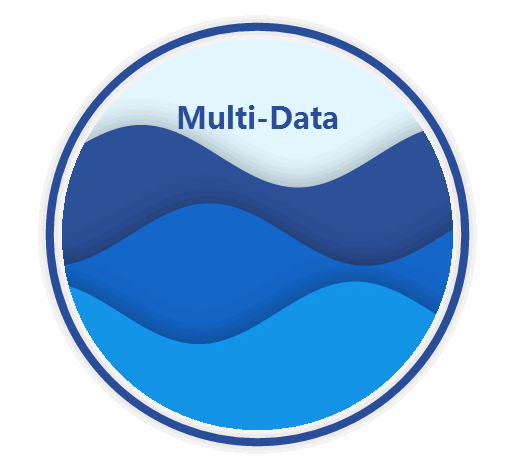
2.2 多個數據顯示
水球圖可顯示多個數據,在data中傳入一個數組即可:
var option = {
    backgroundColor:'white',
    series: [{
        type: 'liquidFill',
        name: 'Multi-Data',
        data: [0.7,0.5,0.3],    //輸入多個數據
        label:{

            normal:{
                position:['50%','20%'],    //此處調節顯示的位置
                formatter: function() {
                return 'Multi-Data';
                },
                textStyle:{
                    fontSize:30,    //設定字型大小

                }
            }
        }
    }]
};
在水球圖中,預設標籤時輸入資料轉換為百分數,如果需要輸入其他文字,則需要用到formatter配置。在label,normal 下的formatter設定對應函式。
同時可以格式化輸出formatter: function() {return 'Multi-Data\n Haha'; },。
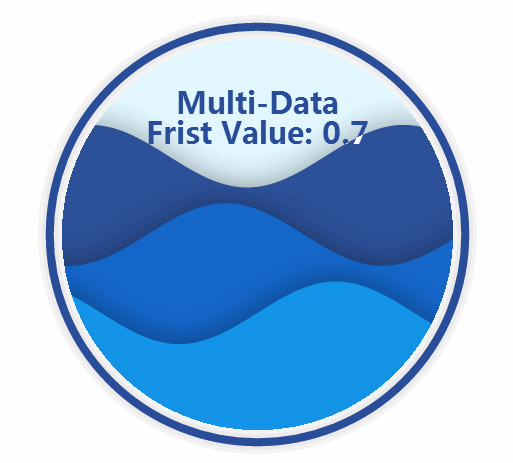
data中的資料也可以是鍵值形式,同時顯示鍵和值:
var option = {
    backgroundColor:'white',
    series: [{
        type: 'liquidFill',
        name: 'Multi-Data',
        data: [{
        		'name':'Frist',
        		'value':'0.7'}
        		,0.5,0.3],    //其中第一個數值由鍵值對錶示
        label:{

            normal:{
                position:['50%','20%'],
                formatter:  '{a}\n{b} Value: {c}',   //{a}表示系列名,{b}為鍵名,{c}為值
                textStyle:{
                    fontSize:30,

                }
            }
        }
    }]
};
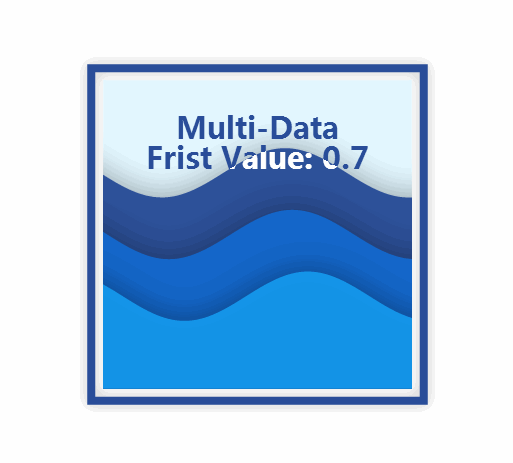
2.3大小和行狀
下一步我們要來改變水球的大小和形狀了,主要使用配置中的radius和shape來改變:
var option = {
    backgroundColor:'white',
    series: [{
        type: 'liquidFill',
        name: 'Multi-Data',
        radius:'80%',   //調整大小
        shape:'ract',   //修改形狀,目前支援	'circle', 'rect', 'roundRect', 'triangle', 'diamond', 'pin', 'arrow'
        //'container'支援佔滿整個元素容器
        //同時還支援svg圖作為形狀:'path://balabalaba'
        data: [{'name':'Frist','value':'0.7'},0.5,0.3],
        label:{

            normal:{
                position:['50%','20%'],
                formatter:  '{a}\n{b} Value: {c}',
                textStyle:{
                    fontSize:30,

                }
            }
        }
    }]
};
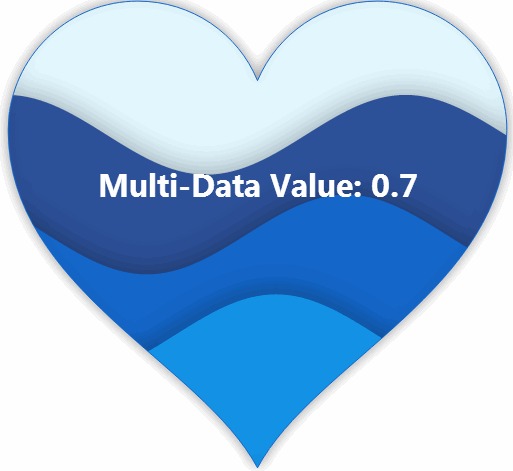
畫svg圖,需要設定邊框外線不顯示outline和backgroundstyle選項:
var option = {
    backgroundColor:'white',
    series: [{
        type: 'liquidFill',
        name: 'Multi-Data',
        radius:'60%',
        shape:"path://M18.98 5.7c-.24-2.36-2.24-4.2-4.66-4.2-1.95 0-3.6 1.18-4.32 2.87-.7-1.7-2.37-2.87-4.32-2.87-2.42 0-4.42 1.84-4.66 4.2L1 6.18c0 5.7 6.98 8.38 9 12.17 2.02-3.8 9-6.48 9-12.17 0-.16 0-.32-.02-.48z", //svg路徑
        data: [{'name':'Frist','value':'0.7'},0.5,0.3],

        outline: {
            show: false,
            },
        backgroundStyle: {
            borderColor: '#156ACF',
            borderWidth: 1,
            shadowColor: 'rgba(0, 0, 0, 0.4)',
            shadowBlur: 20
        },

        label:{

            normal:{
                position:['30%','40%'],
                formatter:  'Value: {c}',
                textStyle:{
                    fontSize:30,

                }
            }
        }
    }]
};
3.API總結
除此之外,還有很多可以調節的引數,下面是預設配置列表,詳細使用請看註釋。
{
    data: [],    //資料輸入,可以為鍵值物件

    color: ['#294D99', '#156ACF', '#1598ED', '#45BDFF'],    //預設波浪顏色
    center: ['50%', '50%'],    //在畫布中的位置
    radius: '50%',             //大小  可以為50% 也可以用50px表示
    amplitude: '8%',		   //波浪幅度
    waveLength: '80%',         //波長
    phase: 'auto',             //相位
    period: 'auto',            //週期
    direction: 'right',        //波動方向
    shape: 'circle',           //形狀

    waveAnimation: true,
    animationEasing: 'linear',
    animationEasingUpdate: 'linear',
    animationDuration: 2000,
    animationDurationUpdate: 1000,

    outline: {
        show: true,    //是否顯示外圈線
        borderDistance: 8,   //與外圈距離
        itemStyle: {
            color: 'none',
            borderColor: '#294D99',  //線的顏色,粗細,模糊程度,模糊顏色
            borderWidth: 8,
            shadowBlur: 20,
            shadowColor: 'rgba(0, 0, 0, 0.25)'
        }
    },

    backgroundStyle: {
        color: '#E3F7FF'    //背景
    },

    itemStyle: {
        opacity: 0.95,   //透明度
        shadowBlur: 50,
        shadowColor: 'rgba(0, 0, 0, 0.4)'
    },

    label: {    //內部字元標籤的屬性
        show: true,
        color: '#294D99',
        insideColor: '#fff',
        fontSize: 50,
        fontWeight: 'bold',

        align: 'center',
        baseline: 'middle'
        position: 'inside'
    },

    emphasis: {
        itemStyle: {
            opacity: 0.8
        }
    }
}
- 完整API如下:
也可以點選Echarts的屬性檢視

From https://github.com/ecomfe/echarts-liquidfill
data {(number|Object)[]}

//Value of each data item should be between 0 and 1.
//The data item can also be an object to configure the option for a single item.
//Could defines a chart with the second wave of red color.

color {string[]}

//Wave colors.

shape {string}

//Shape of water fill chart. It can be one of the default symbols: 'circle', 'rect', 'roundRect', 'triangle', 'diamond', 'pin', 'arrow'. Or, an SVG path starting with 'path://'.

center {string[]}

//Position of the chart. The first value is x position, the second one is the y position. Each of the values can be a relative value like '50%', which is relative to the smaller value of container width and height, or an absolute value like 100px.

radius {string}

//Radius of the chart, which can be a relative value like '50%', which is relative to the smaller value of container width and height, or an absolute value like 100px.

amplitude {number}

//Amplitude of the wave, in pixels or percentage. If it is in percentage, it's relative to the diameter.

waveLength {string|number}

//Wave length of the wave, which can be a relative value like '50%', which is relative to the diameter, or an absolute value like '100px' or 100.

phase {number}

//Phase of wave, in radian system. By default, it is set to be 'auto', when each wave has a phase of Math.PI / 4 larger than the previous one.

period {number|'auto'|function}

//Milliseconds that it takes to move forward a wave-length. By default, it is set to be 'auto', when the wave at the front has a greater speed.
//It can also be a formatter function.
direction {string}

//Direction that the waves moving in, which should either be 'right', or 'left'.

waveAnimation {boolean}

//Whether to enable wave from moving left or right.

animationEasing {string}

//Easing methods for initial animation, when waves raise from the bottom at the beginning.

animationEasingUpdate {string}

//Easing methods for other animation, for example, when data value changes and wave position changes.

animationDuration {number}

//Initial animation duration, in milliseconds.

animationDurationUpdate {number}

//Other animation duration, in milliseconds.

outline.show {boolean}

//Whether to display outline.

outline.borderDistance {number}

//Distance between border and inner circle.

outline.itemStyle.borderColor {string}

//Border color.

outline.itemStyle.borderWidth {number}

//Border width.

outline.itemStyle.shadowBlur {number}

//Outline shadow blur size.

outline.itemStyle.shadowColor {string}

//Outline shadow color.

backgroundStyle.color {string}

//Background fill color.

backgroundStyle.borderWidth {string}

//Background stroke line width.

backgroundStyle.borderColor {string}

//Background stroke line width.

backgroundStyle.itemStyle.shadowBlur {number}

//Background shadow blur size.

backgroundStyle.itemStyle.shadowColor {string}

//Background shadow color.

backgroundStyle.itemStyle.opacity {number}

//Background opacity.

itemStyle.opacity {number}

//Wave opacity.

itemStyle.shadowBlur {number}

//Wave shadow width.

itemStyle.shadowColor {string}

Wave shadow color.

emphasis.itemStyle.opacity {number}

//Wave opacity when hover.

label.show {boolean}

//Whether to display label text.

label.color {string}

//Color of text when display on background.

label.insideColor {string}

//Color of text when display on wave.

label.fontSize {number}

//Label font size.

label.fontWeight {string}

//Label font weight.

label.align {string}

//Text align, which should be 'left', 'center', or 'right'.

label.baseline {string}

//Text vertical align, which should be 'top', 'middle', or 'bottom'.

label.position {string|string[]}

//Text position is at the center by default. label.position can be set to be 'inside', 'left', 'right', 'top', 'bottom', or horizontal and vertical positions like ['10%', '20%'], which means '10%' to the left and '20%' to the top.
ref:
doc & src:https://github.com/ecomfe/echarts-liquidfill
https://ecomfe.github.io/echarts-liquidfill/example/
http://gallery.echartsjs.com/editor.html?c=liquidfill-basic
http://gallery.echartsjs.com/editor.html?c=liquidfill-echarts
http://gallery.echartsjs.com/editor.html?c=xry0tUfcBe
http://gallery.echartsjs.com/explore.html?u=bd-4013131402
http://zhangwenli.com/