
火焰圖&perf命令
阿新 • • 發佈:2018-11-28
最近惡補後端技術,發現還是很多不懂,一直寫業務邏輯容易迷失,也沒有成長。自己做系統,也習慣用自己已知的知識來解決,以後應該多點調研,學到更多的東西應用起來。
先學一個新的效能分析命令。
1 NAME 2 perf - Performance analysis tools for Linux 3 4 SYNOPSIS 5 perf [--version] [--help] COMMAND [ARGS] 6 7 DESCRIPTION 8 Performance counters for Linux are a new kernel-based subsystem that provide a framework forall things performance analysis. It covers hardware level (CPU/PMU, Performance Monitoring Unit) features and software features 9 (software counters, tracepoints) as well. 10 11 SEE ALSO 12 perf-stat(1), perf-top(1), perf-record(1), perf-report(1), perf-list(1)
perf record子命令:
1NAME 2 perf-record - Run a command and record its profile into perf.data 3 4 SYNOPSIS 5 perf record [-e <EVENT> | --event=EVENT] [-l] [-a] <command> 6 perf record [-e <EVENT> | --event=EVENT] [-l] [-a] -- <command> [<options>] 7 8 DESCRIPTION9 This command runs a command and gathers a performance counter profile from it, into perf.data - without displaying anything. 10 11 This file can then be inspected later on, using perf report.
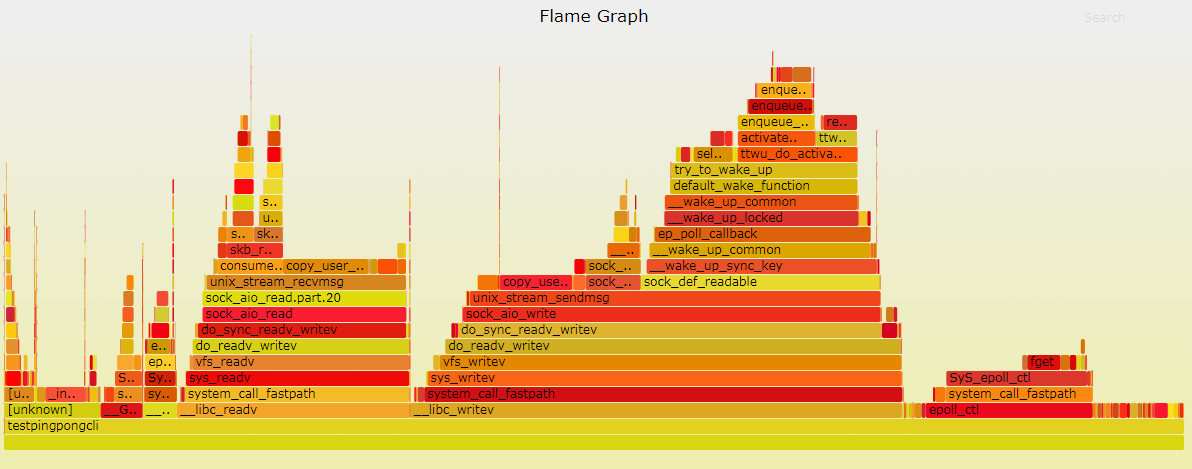
火焰圖是基於 perf 結果產生的 SVG 圖片,用來展示 CPU 的呼叫棧。
y 軸表示呼叫棧,每一層都是一個函式。呼叫棧越深,火焰就越高,頂部就是正在執行的函式,下方都是它的父函式。
x 軸表示抽樣數,如果一個函式在 x 軸佔據的寬度越寬,就表示它被抽到的次數多,即執行的時間長。注意,x 軸不代表時間,而是所有的呼叫棧合併後,按字母順序排列的。
火焰圖就是看頂層的哪個函式佔據的寬度最大。只要有"平頂"(plateaus),就表示該函式可能存在效能問題。
顏色沒有特殊含義,因為火焰圖表示的是 CPU 的繁忙程度,所以一般選擇暖色調。
http://www.ruanyifeng.com/blog/2017/09/flame-graph.html
生成工具:
https://github.com/brendangregg/FlameGraph
示例:
1 perf record -F 99 -p 181 -g -- sleep 60
2 perf script > out.perf
3 ./stackcollapse-perf.pl out.perf --all > out.folded
4 ./flamegraph.pl out.kern_folded > kernel.svg