R語言-箱型圖&熱力圖
阿新 • • 發佈:2018-11-29
1.箱型圖
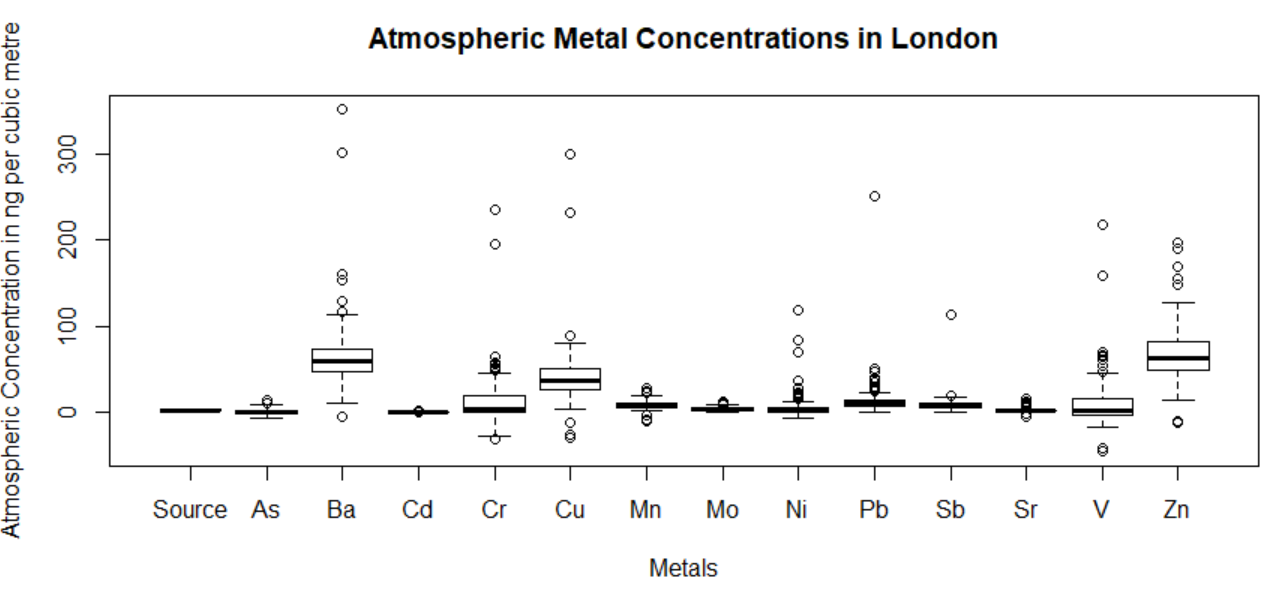
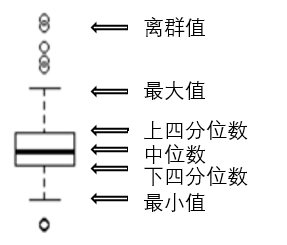
boxplot()函式
> metals<-read.csv("metals.csv",header=TRUE)                  #讀取檔案和列名
> boxplot(metals,                                             #資料集
+ xlab="Metals",                                              #設定X軸標題
+ ylab="Atmospheric Concentration in ng per cubic metre",     #設定Y軸標題
+ main="Atmospheric Metal Concentrations in London")          #設定圖示題


2.熱力圖
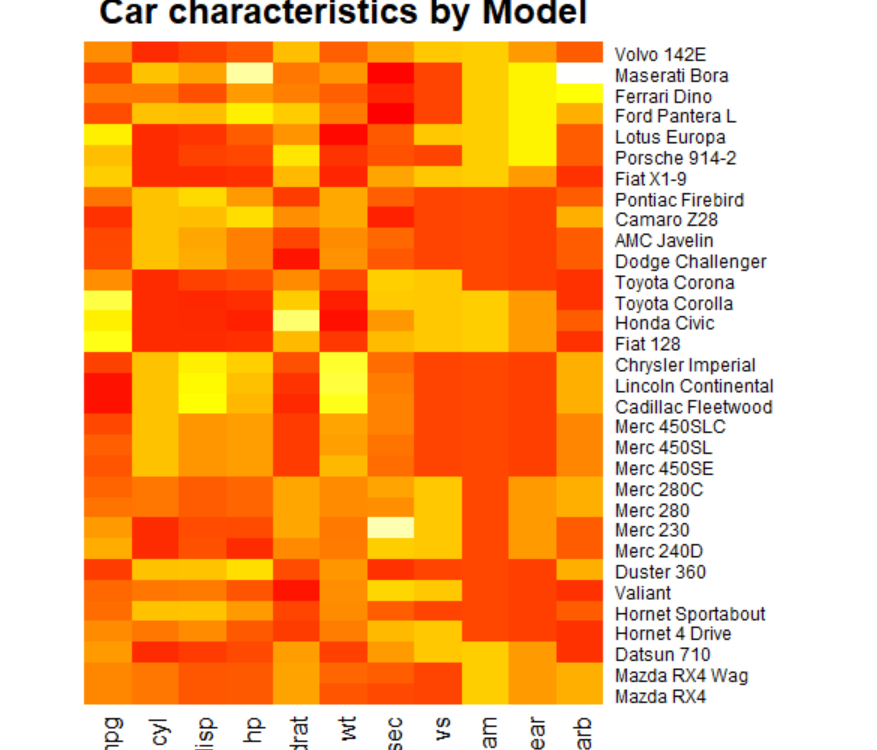
heatmap()函式
> heatmap(as.matrix(mtcars),                   #將自帶資料集mtcars轉為矩陣
+ Rowv=NA,                                     #不基於行聚類
+ Colv=NA,                                     #不基於列聚類
+ col = heat.colors(256),                      #生成256種顏色
+ scale="column",                              #值集中的方向按列
+ margins=c(2,8),                              #設定頁邊空白大小
+ main = "Car characteristics by Model")       #設定圖示題

