Echart+signalR實現實時檢測伺服器CPU狀態
阿新 • • 發佈:2018-12-01
1.前端程式碼
<h2>CPU使用率</h2>
<div id="mychart" style="width:600px;height:300px;"></div>
@section scripts{
    <script src="~/Scripts/Echart/echarts.js"></script>
    <script src="~/Scripts/Echart/macarons.js"></script>
   <script src="~/Scripts/jquery.signalR-2.3.0.min.js"></script>
    <script src="~/signalr/hubs"></script>
    <script>
        ///下面的程式碼宣告對中心代理的引用。
        var chat = $.connection.cpuHub;
        $.connection.hub.start();
        $(function () {
            var time=[]
            var myChart = echarts.init(document.getElementById('mychart'), "macarons");
            var data = [];
            function addData(shift) {
                if (shift) {
                    data.shift();
                    time.shift();
                    console.log("data 資料後的長度:" + data.length);
                    console.log("time 資料後的長度:" + time.length);
                }
            }
            //接受服務端資料
            chat.client.addNewMessageToPage = function (mes) {
                time.push(getTime(new Date()));
                data.push(mes);
            };

            option = {
                title: {
                    text: 'cpu佔用率'
                },
                tooltip: {
                    trigger: 'axis',
                    axisPointer: {
                        type: 'cross',
                        label: {
                            backgroundColor: '#6a7985'
                        }
                    }
                },
                toolbox: {//平鋪、摺疊、生成png圖片
                    show: true,
                    feature: {

                        dataView: { readOnly: false },
                        magicType: { show: true, type: ['stack', 'tiled', 'line', 'bar'] },
                        restore: { show: true },
                        saveAsImage: { show: true }
                    }
                },

                xAxis: {
                    type: 'category',
                    boundaryGap: false,
                    splitLine: {
                        show: true,//是否顯示網格線
                    },
                   name:"時間"
                },
                yAxis: {
                    boundaryGap: [0, '50%'],
                    type: 'value',
                    axisLabel: {
                        formatter: '{value}'
                    },
                    name:"單位(%)",
                    splitLine: {
                        show: true,//是否顯示網格線
                    },
                    max:100
                },
                series: [
                    {
                        name: 'CPU',
                        type: 'line',
                        smooth: true,
                        symbol: 'none',
                        stack: 'a',
                        data: data
                    }
                ]
            };
            myChart.setOption(option);
            setInterval(function () {
                addData(true)
                console.log("data 資料前的長度:" + data.length);
                console.log("time 資料前的長度:" + time.length);
                myChart.setOption({
                    xAxis: {
                        data: time,
                        },
                    series: [{
                        name: 'CPU',
                        data: data
                    }]
                });
            }, 1500);
        })
        function getTime(date) {
            var Hours = date.getHours();//獲取當前小時數(0-23)
            var Minutes = date.getMinutes(); //獲取當前分鐘數(0-59)
            var Seconds = date.getSeconds();//獲取當前秒數(0-59)
            var Milliseconds = date.getMilliseconds();//獲取當前毫秒數(0-999)
            return Hours + ":" + Minutes + ":" + Seconds
        }
    </script>}
2.後臺程式碼
    public ActionResult Index()
        {
            System.Timers.Timer timer = new System.Timers.Timer();
            timer.Elapsed += new System.Timers.ElapsedEventHandler(Send);
            timer.Interval = 1000;
            timer.Enabled = true;
            timer.Start();
            return View();
        }
        public void Send(object sender, System.Timers.ElapsedEventArgs e)
        {
            Microsoft.AspNet.SignalR.GlobalHost.ConnectionManager.GetHubContext<CpuHub>().Clients.All.addNewMessageToPage(s.CpuLoad);//向客戶端推送佔用率
        }
3.處理訊息
 [HubName("cpuHub")]
    public class CpuHub : Hub
    {
        public void Send(string meesges)
        {
            Clients.All.addNewMessageToPage(meesges);
        }
    }
4.在MVC中Startup.cs註冊 SignalR
 public partial class Startup
    {
        public void Configuration(IAppBuilder app)
        {
            ConfigureAuth(app);
            //註冊SignalR
            app.MapSignalR();
        }
    }
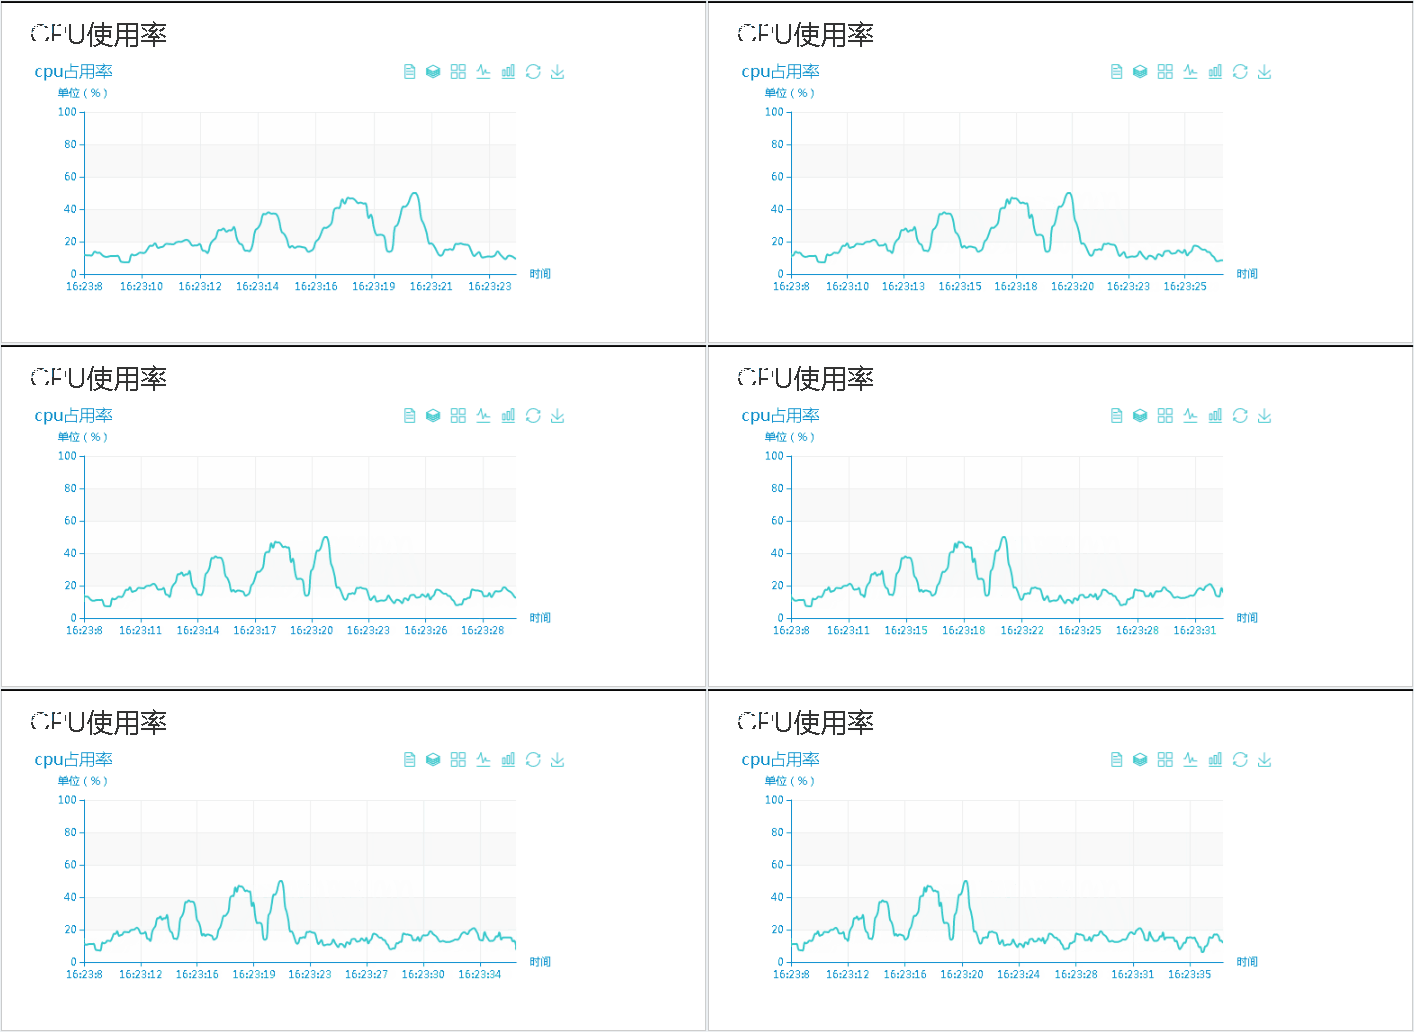
附上效果圖

缺陷:
1.存在x軸最後一個時間顯示不出來(資料量和X軸長度是一樣的),
2.還需優化的地方,進出不成比列(進大於出),時間長了,資料量累計很多
分享大家,有需要的朋友可以參考下,對以上不足的兩點,希望大牛指點下,
