
Geoserver跨域終極解決方案
在其他程式呼叫使用Geoserver時,可能會遇到跨域
如
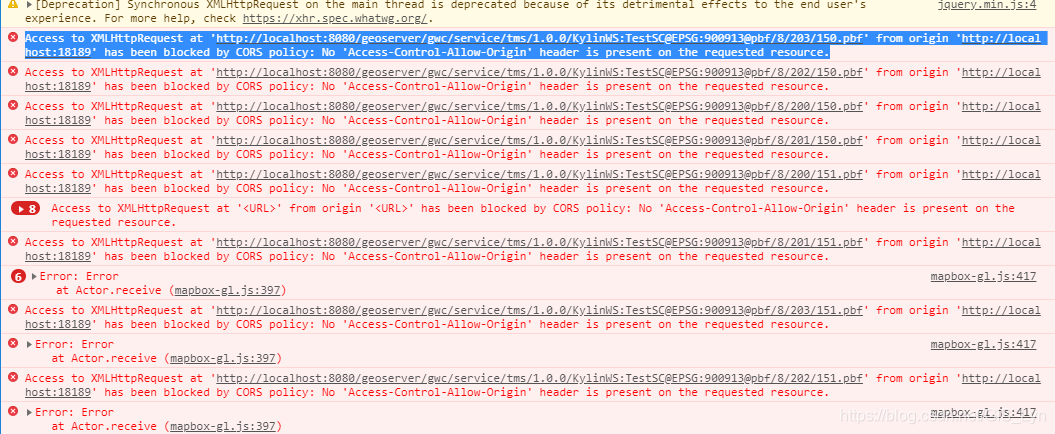
Access to XMLHttpRequest at 'http://localhost:8080/geoserver/gwc/service/tms/1.0.0/KylinWS:[email protected]:[email protected]/8/203/150.pbf' from origin 'http://localhost:18189' has been blocked by CORS policy: No 'Access-Control-Allow-Origin' header is present on the requested resource.
以使用太樂地圖WebGIS開發平臺進行開發為例,
在使用太樂地圖WebGIS開發平臺 for Mapboxgl時,呼叫geoserver的MBtiles,遇到跨域的問題,導致地圖看不到
Chrome中F12開發者模式中看到的錯誤
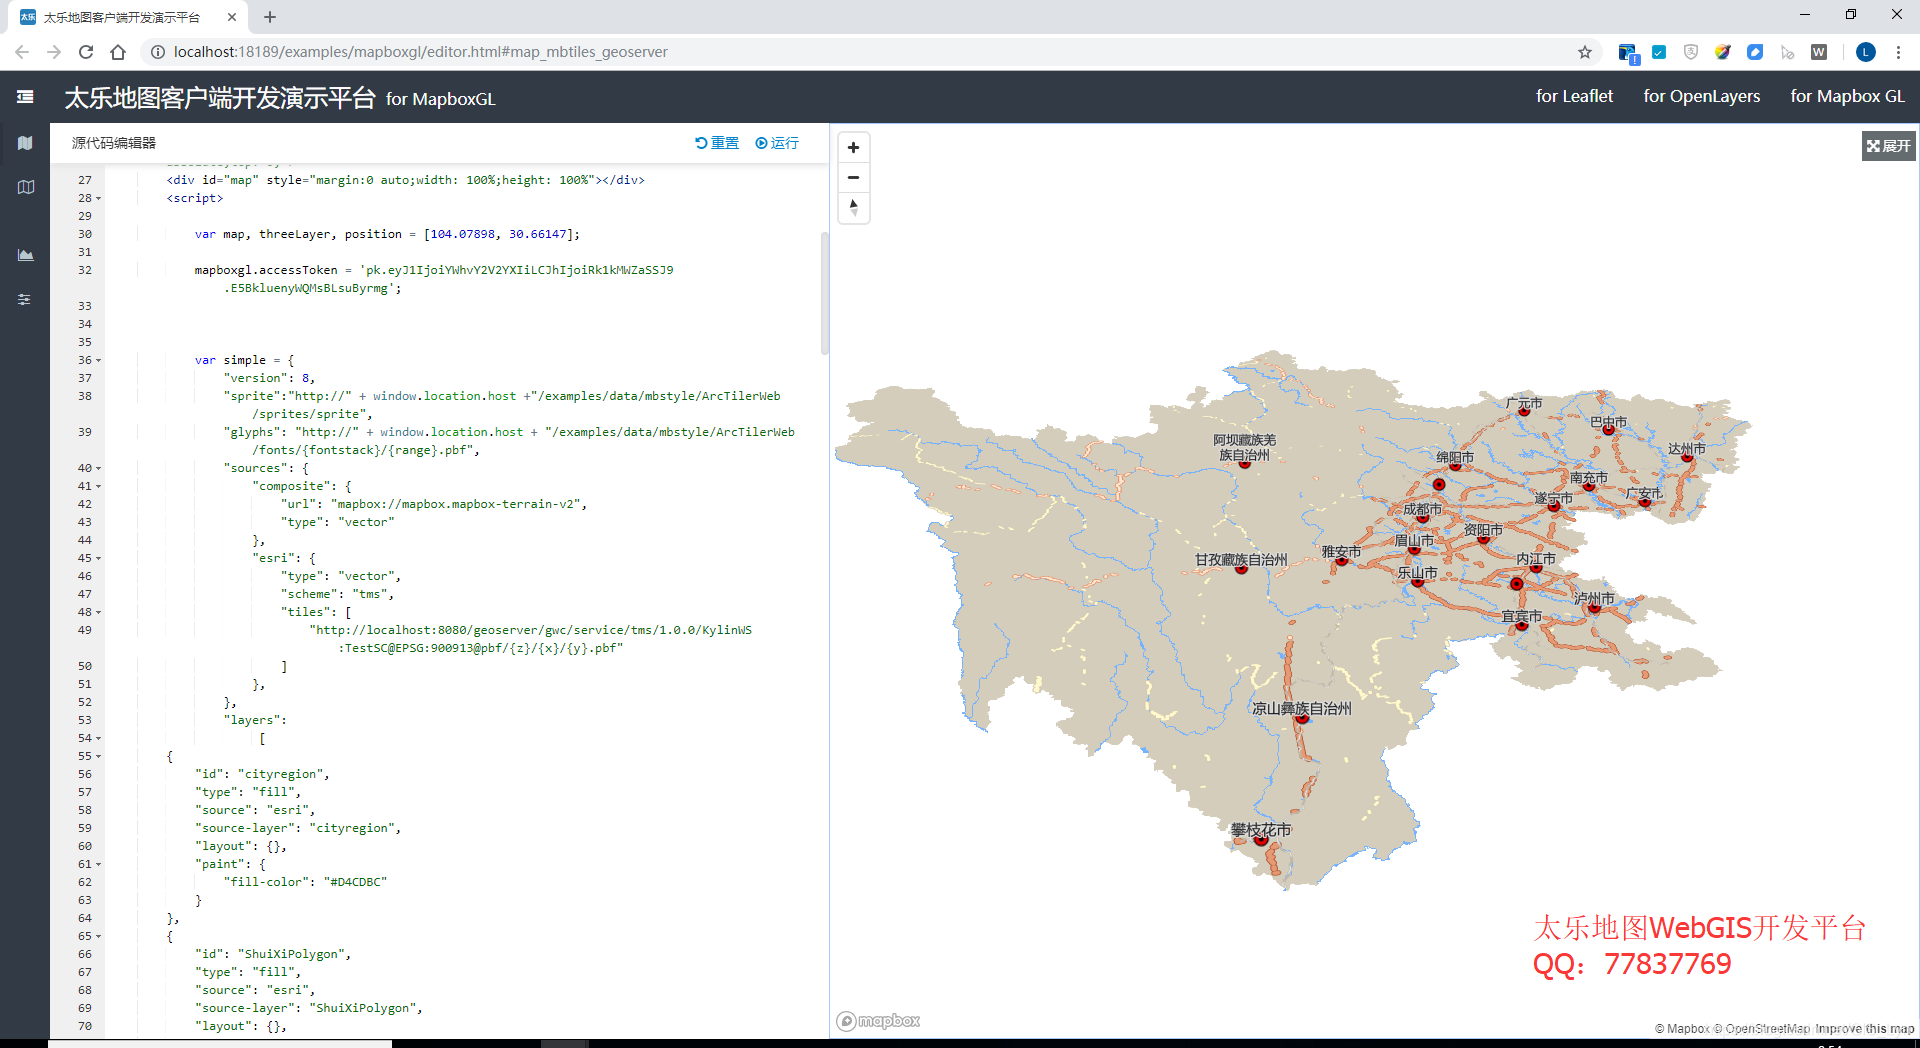
太樂地圖mapboxgl示例頁面也看不到地圖

這是因為Geoserver或tomcat沒有開啟允許跨域訪問。
兩種方式釋出GeoServer,分別是Jetty與Tomcat
兩種方式跨域 cross origin 解決方法不同,看完繼續看第三種解決方法
- Jetty釋出的解決方法
https://www.cnblogs.com/arxive/p/8673399.html
https://blog.csdn.net/geol200709/article/details/80320824
- 方法2:Tomcat釋出的Geoserver跨域解決方法
To add CORS headers, I simply added to $CATALINA_HOME/conf/web.xml the following lines:
<filter>
  <filter-name>CorsFilter</filter-name>
  <filter-class>org.apache.catalina.filters.CorsFilter</filter-class>
  <init-param>
    <param-name>cors.allowed.origins</param-name>
    <param-value>*</param-value>
  </init-param>
</filter>
<filter-mapping>
  <filter-name>CorsFilter</filter-name>
  <url-pattern>/*</url-pattern>
</filter-mapping>
最後一種解決方法:
- 方法3:使用代理
自己寫一個proxy.php,proxy.ashx,proxy.xxx
網上有許多代理的文章
跨域開啟後,geoserver的向量瓦片地圖地圖可以訪問了
http://localhost:18189/examples/mapboxgl/editor.html#map_mbtiles_geoserver
順便分享一下太樂地圖WebGIS開發平臺訪問geoserver的mbtiles的程式碼
 var map, threeLayer, position = [104.07898, 30.66147];

            mapboxgl.accessToken = 'pk.eyJ1IjoiYWhvY2V2YXIiLCJhIjoiRk1kMWZaSSJ9.E5BkluenyWQMsBLsuByrmg';


            var simple = {
                "version": 8,
                "sprite":"http://" + window.location.host +"/examples/data/mbstyle/ArcTilerWeb/sprites/sprite",
                "glyphs": "http://" + window.location.host + "/examples/data/mbstyle/ArcTilerWeb/fonts/{fontstack}/{range}.pbf",
                "sources": {
                    "composite": {
                        "url": "mapbox://mapbox.mapbox-terrain-v2",
                        "type": "vector"
                    },
                    "esri": {
                        "type": "vector",
                        "scheme": "tms",
                        "tiles": [
                            "http://localhost:8080/geoserver/gwc/service/tms/1.0.0/KylinWS:[email protected]:[email protected]/{z}/{x}/{y}.pbf"
                        ]
                    },
                },
                "layers":
                     [
        {
            "id": "cityregion",
            "type": "fill",
            "source": "esri",
            "source-layer": "cityregion",
            "layout": {},
            "paint": {
                "fill-color": "#D4CDBC"
            }
        },
        {
            "id": "ShuiXiPolygon",
            "type": "fill",
            "source": "esri",
            "source-layer": "ShuiXiPolygon",
            "layout": {},
            "paint": {
                "fill-color": "#73B2FF"
            }
        },
        {
            "id": "XianDao/1",
            "type": "line",
            "source": "esri",
            "source-layer": "XianDao",
            "minzoom": 8.58,
            "layout": {
                "line-cap": "round",
                "line-join": "round"
            },
            "paint": {
                "line-color": "#B9B7B9",
                "line-width": 4.13333
            }
        },
        {
            "id": "XianDao/0",
            "type": "line",
            "source": "esri",
            "source-layer": "XianDao",
            "minzoom": 8.58,
            "layout": {
                "line-cap": "round",
                "line-join": "round"
            },
            "paint": {
                "line-color": "#FFFFFF",
                "line-width": 2.13333
            }
        },
        {
            "id": "ShengDao/1",
            "type": "line",
            "source": "esri",
            "source-layer": "ShengDao",
            "layout": {
                "line-cap": "round",
                "line-join": "round"
            },
            "paint": {
                "line-color": "#D4C9B4",
                "line-width": 4.66667
            }
        },
        {
            "id": "ShengDao/0",
            "type": "line",
            "source": "esri",
            "source-layer": "ShengDao",
            "layout": {
                "line-cap": "round",
                "line-join": "round"
            },
            "paint": {
                "line-color": "#FFF9CC",
                "line-width": 2.66667
            }
        },
        {
            "id": "GuoDao/1",
            "type": "line",
            "source": "esri",
            "source-layer": "GuoDao",
            "layout": {
                "line-cap": "round",
                "line-join": "round"
            },
            "paint": {
                "line-color": "#E68C65",
                "line-width": 5.06667
            }
        },
        {
            "id": "GuoDao/0",
            "type": "line",
            "source": "esri",
            "source-layer": "GuoDao",
            "layout": {
                "line-cap": "round",
                "line-join": "round"
            },
            "paint": {
                "line-color": "#FFE6CF",
                "line-width": 3.06667
            }
        },
        {
            "id": "gaosu/1",
            "type": "line",
            "source": "esri",
            "source-layer": "gaosu",
            "layout": {
                "line-cap": "round",
                "line-join": "round"
            },
            "paint": {
                "line-color": "#B35933",
                "line-width": 5.6
            }
        },
        {
            "id": "gaosu/0",
            "type": "line",
            "source": "esri",
            "source-layer": "gaosu",
            "layout": {
                "line-cap": "round",
                "line-join": "round"
            },
            "paint": {
                "line-color": "#E69973",
                "line-width": 4
            }
        },
        {
            "id": "TieLu/1",
            "type": "line",
            "source": "esri",
            "source-layer": "TieLu",
            "layout": {
                "line-join": "round"
            },
            "paint": {
                "line-color": "#BFB8AA",
                "line-width": 1.88973
            }
        },
        {
            "id": "TieLu/0",
            "type": "line",
            "source": "esri",
            "source-layer": "TieLu",
            "layout": {
                "line-join": "round"
            },
            "paint": {
                "line-color": "#E6E6E6",
                "line-width": 0.755867,
                "line-dasharray": [
                    10.5839,
                    12.3479
                ]
            }
        },
        {
            "id": "GuoDao/label/Class 1",
            "type": "symbol",
            "source": "esri",
            "source-layer": "GuoDao",
            "minzoom": 9.87,
            "layout": {
                "symbol-placement": "line",
                "text-font": [
                    "Microsoft YaHei Regular"
                ],
                "text-size": 13.3333,
                "text-max-width": 8,
                "text-field": "{PathName}",
                "text-optional": true
            },
            "paint": {
                "text-color": "#000000"
            }
        },
        {
            "id": "gaosu/label/Class 1",
            "type": "symbol",
            "source": "esri",
            "source-layer": "gaosu",
            "layout": {
                "symbol-placement": "line",
                "text-font": [
                    "Microsoft YaHei Regular"
                ],
                "text-size": 13.3333,
                "text-max-width": 8,
                "text-field": "{PathName}",
                "text-optional": true
            },
            "paint": {
                "text-color": "#000000"
            }
        },
        {
            "id": "citypoint",
            "type": "symbol",
            "source": "esri",
            "source-layer": "citypoint",
            "layout": {
                "icon-image": "citypoint",
                "icon-allow-overlap": true,
                "text-font": [
                    "Microsoft YaHei Regular"
                ],
                "text-size": 13.3333,
                "text-anchor": "bottom",
                "text-max-width": 8,
                "text-field": "{Name}",
                "text-optional": true
            },
            "paint": {
                "text-color": "#000000",
                "text-halo-color": "#E1E1E1",
                "text-halo-width": 1.33333
            }
        },
        {
            "id": "XianPoint",
            "type": "symbol",
            "source": "esri",
            "source-layer": "XianPoint",
            "minzoom": 7.94,
            "layout": {
                "icon-image": "XianPoint",
                "icon-allow-overlap": true,
                "text-font": [
                    "Microsoft YaHei Regular"
                ],
                "text-size": 13.3333,
                "text-anchor": "center",
                "text-max-width": 8,
                "text-field": "{Name}",
                "text-optional": true
            },
            "paint": {
                "text-color": "#000000"
            }
        },
        {
            "id": "XianZhen",
            "type": "symbol",
            "source": "esri",
            "source-layer": "XianZhen",
            "minzoom": 9.98,
            "layout": {
                "icon-image": "XianZhen",
                "icon-allow-overlap": true,
                "text-font": [
                    "Microsoft YaHei Regular"
                ],
                "text-size": 13.3333,
                "text-anchor": "bottom",
                "text-max-width": 8,
                "text-field": "{Name}",
                "text-optional": true
            },
            "paint": {
                "text-color": "#000000"
            }
        }
                     ]


            }

            var map = new mapboxgl.Map({
                container: 'map',
                style: simple,
                zoom: 8,
                center: [104.07898, 30.66147]
            });

            map.addControl(new mapboxgl.NavigationControl(), 'top-left');