Matplotlib學習筆記(更新中)
阿新 • • 發佈:2018-12-09
Matplotlib是最流行的Python底層繪相簿,主要做資料視覺化圖表,名字取材於MATLAB。
我覺得學習一門技術最好的辦法就是實踐它,所以我直接用例子來記錄,需要理解和記憶的地方我都加了註釋。
折線圖
#匯入需要用到的模組
from matplotlib import pyplot as plt
import random
from matplotlib import font_manager
#輸入x軸和y軸的值(二者必須個數相等一一對應)
x = range(0,120)
y_1 = [random.randint(20,35) for i in range(120)]
y_2 = [random.randint(20 ,35) for i in range(120)]
#配置圖片大小及清晰度,以及解決中文字型無法顯示的問題
fig = plt.figure(figsize=(20,8),dpi = 80)
font = font_manager.FontProperties(fname="C:\Windows\Fonts\msyh.ttc")
#自定義顯示x軸刻度文字
_xtick_labels = ["10點{}分".format(str(i).rjust(2,'0')) for i in range(60)]
_xtick_labels += ["11點{}分".format(str(i).rjust(2,'0' )) for i in range(60)]
#調整x軸刻度間距並指定字型樣式
plt.xticks(x[::3], _xtick_labels[::3], rotation = 45, fontproperties=font)
plt.yticks(range(min(min(y_1),min(y_2)), max(max(y_1)+1,max(y_2)+1)), fontproperties=font)
#新增描述資訊
plt.xlabel("時間", fontproperties=font)
plt.ylabel("溫度 單位(℃)", fontproperties=font)
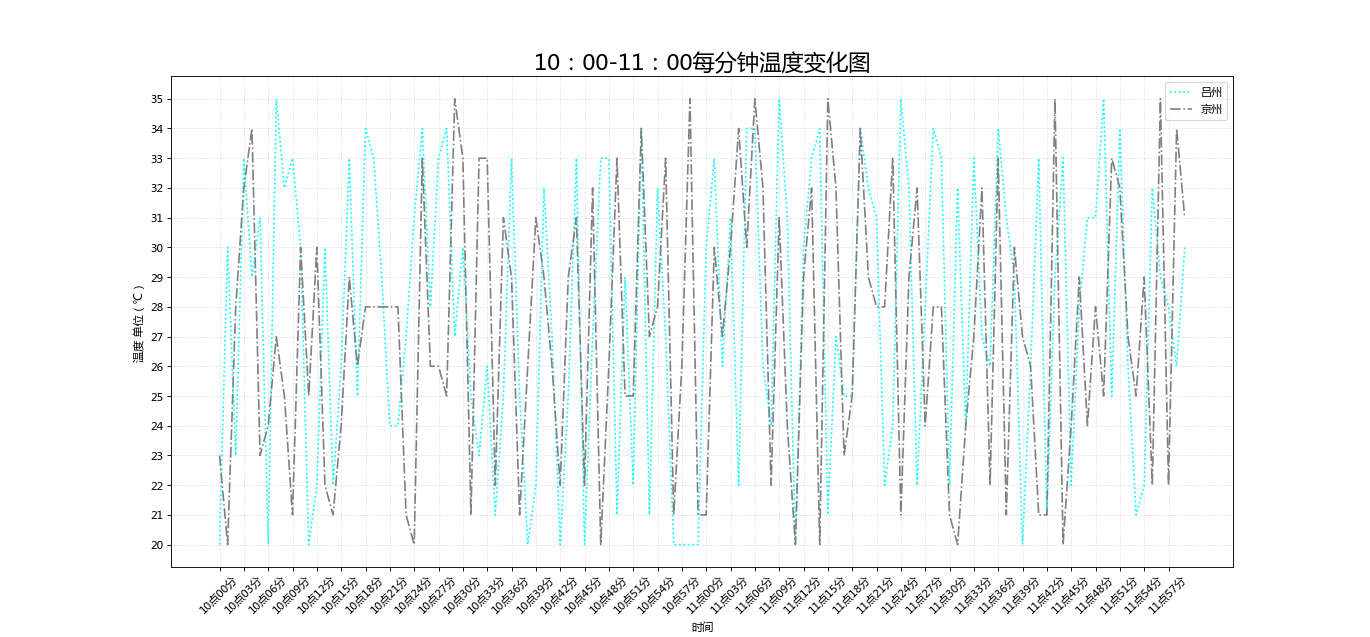
plt.title("10:00-11:00每分鐘溫度變化圖" , fontproperties=font, size=20)
#新增網格(alpha控制透明度,linestyle控制線型)
plt.grid(alpha=0.5, linestyle=":")
#畫多條折線就多次呼叫plot函式(label為圖例中的文字描述)
plt.plot(x,y_1, label="呂州", color="cyan", linestyle=":")
plt.plot(x,y_2, label="京州", color="gray", linestyle="-.")
#僅僅在圖例中的字型需要用prop來指定,其餘都用fontproperties來指定
plt.legend(prop=font)
# 將生成的影象儲存為svg向量圖(當然也可以儲存為其他格式)
plt.savefig("./test1.svg")
#展示圖形
plt.show()
結果如圖: