各資料特徵與房價的關係
阿新 • • 發佈:2018-12-10
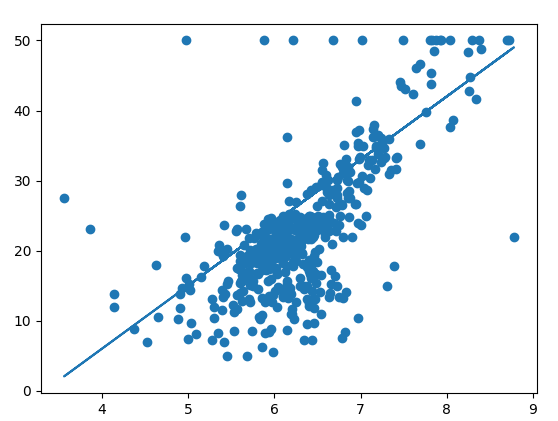
from sklearn.datasets import load_boston
boston = load_boston()
print(boston.keys())

data = boston.data
x = data[:,5]
y = boston.target

import matplotlib.pyplot as plt
plt.scatter(x,y)
plt.plot(x,9*x-30)
plt.show()
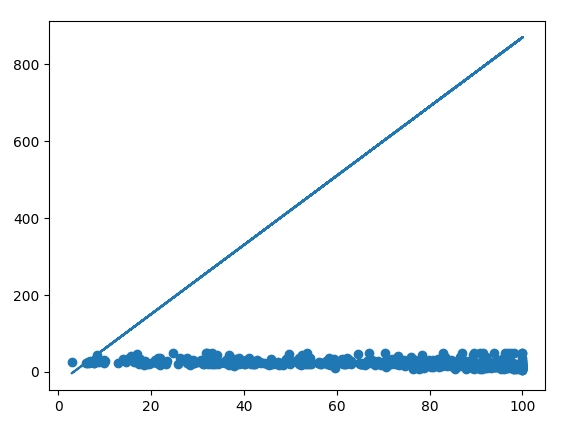
from sklearn.datasets import load_boston boston = load_boston() print(boston.keys()) data = boston.data x = data[:,6] y = boston.target import matplotlib.pyplot as plt plt.scatter(x,y) plt.plot(x,9*x-30) plt.show()
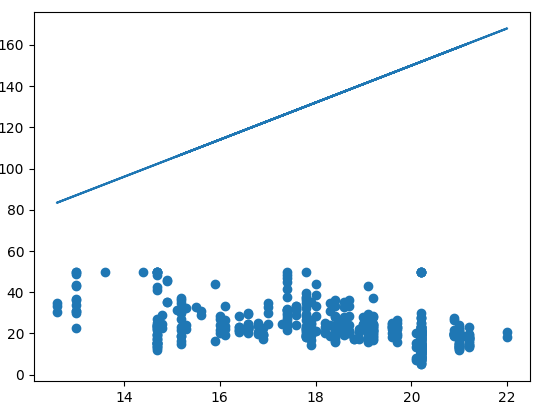
from sklearn.datasets import load_boston boston = load_boston() print(boston.keys()) data = boston.data x = data[:,10] y = boston.targetimport matplotlib.pyplot as plt plt.scatter(x,y) plt.plot(x,9*x-30) plt.show()
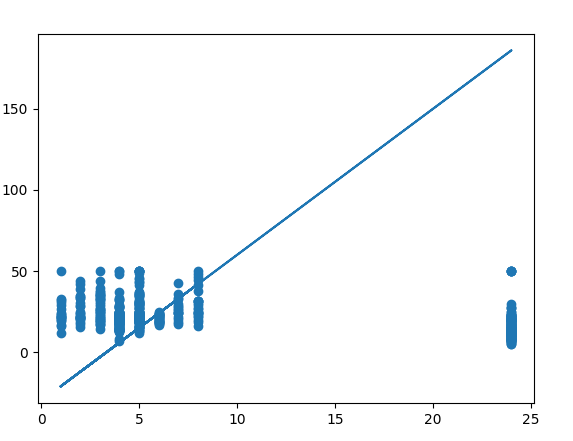
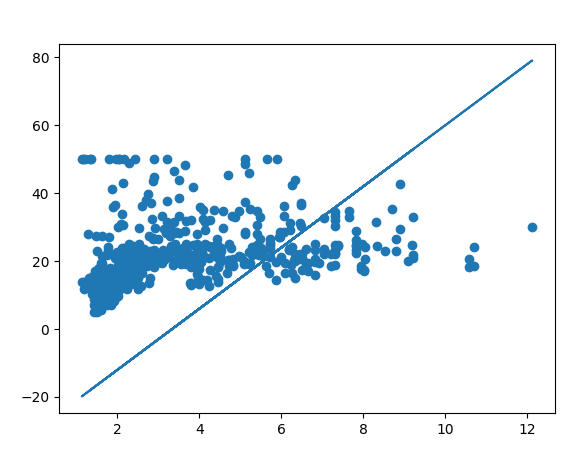
from sklearn.datasets import load_boston boston = load_boston() print(boston.keys()) data = boston.data x = data[:,7] y = boston.target import matplotlib.pyplot as plt plt.scatter(x,y) plt.plot(x,9*x-30) plt.show()
from sklearn.datasets import load_boston
boston = load_boston()
print(boston.keys())

data = boston.data
x = data[:,9]
y = boston.target

import matplotlib.pyplot as plt
plt.scatter(x,y)
plt.plot(x,9*x-30)
plt.show()

from sklearn.datasets import load_boston
boston = load_boston()
print(boston.keys())

data = boston.data
x = data[:,8]
y = boston.target

import matplotlib.pyplot as plt
plt.scatter(x,y)
plt.plot(x,9*x-30)
plt.show()