
python 視覺化:用fig, ax = plt.subplots()在一個視窗繪製多個圖表
目錄
背景: 《Python for Data Analysis》 2nd Edition裡邊多次出現:
fig, ax = plt.subplots()一、fig, ax = plt.subplots()的作用?
它是用來輸出 總畫布“視窗”的(fig:是figure的縮寫),有了畫布就可以在上邊作圖了。
等價於
fig = plt.figure()
ax = plt.subplot(111)
二、引數的含義?
首先看 fig = plt.figure()
matpltlib.pyplot.figure(
num = None,
figsize=None,
dpi=None,
facecolor=None,
edgecolor=None,
frameon=True,
FigureClass=<class 'matplotlib.figure.Figure'>,
clear=False,
**kwargs)
num:設定figure名稱。系統預設升序命名figure(透視表輸出視窗)e.g. “figure1”。可自行設定figure名稱,名稱或是INT,或是str型別;
figsize:設定figure尺寸。系統預設命令是rcParams["figure.fig.size"] = [6.4, 4.8],即figure長寬為6.4 * 4.8;
dpi:設定figure畫素密度。系統默命令是rcParams["sigure.dpi"] = 100;
facecolor:設定figure背景色。系統預設命令是rcParams["figure.facecolor"] = 'w',即白色white;
frameon / edgecolor:設定要不要繪製輪廓&輪廓顏色。系統預設繪製輪廓,輪廓染色rcParams["figure.edgecolor"]='w',即白色white;
Figureclass:設定使不使用一個figure模板。系統預設不使用;
clear:設定當同名figure存在時,是否替換它。系統預設False,即不替換。
然後看ax = plt.subplot()
三、多維透檢視怎麼做?
比如說我們想畫個2*2的子圖,每個子圖輸出一個對應的圖表。
- 先重點考慮2個步驟。
· 第1個步驟:建立多維視窗:
· 第2個步驟:設定各個透視子圖在視窗的位置:
fig, axes = plt.subplots(2, 2)data.plot.bar(ax=axes[1,1], color='b', alpha=0.5)
data.plot.barh(ax=axes[0,1], color='k', alpha=0.5)附註:
· plot.bar(ax=[])引數ax=[] 來設定圖表的子圖座標。ax=[0,1]表示水平條形圖位置在右上角,即第1行,第2列;
· alpha:設定圖表的透明度;
- 再新增子透檢視程式碼。
· 第3個步驟:得到完整的程式碼:
import pandas as pd
import numpy as np
import matplotlib.pyplot as plt

fig, axes = plt.subplots(2, 2)

data = pd.Series(np.random.rand(16), index=list('abcdefghijklmnop'))

data.plot.bar(ax=axes[1,1], color='b', alpha = 0.5)
data.plot.barh(ax=axes[0,1], color='k', alpha=0.5)


plt.show()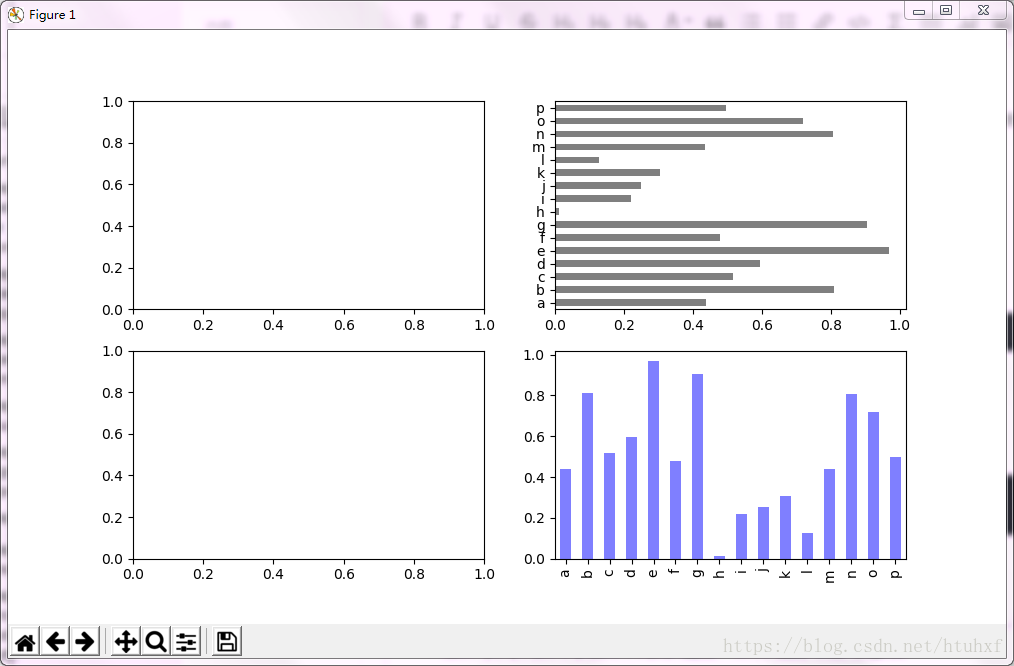
四、同坐標的多維透檢視怎麼做?
最主要的一點是讓多個圖線共用一個x座標軸。
- 語句規定N個折線圖共用一個x座標:
import numpy as np
import matplotlib.pyplot as plt

fig, ax1 = plt.subplots(1, 1)             # 做1*1個子圖,等價於 fig, ax1 = plt.subplot()

ax2 = ax1.twinx()                         # 讓2個子圖軸一樣;

# 作y=sin(x)函式
x1 = np.linspace(0, 4 * np.pi, 100)
y1 = np.sin(x1)
ax1.plot(x1, y1)

#  作y = cos(x)函式
x2 = np.linspace(0, 4 * np.pi, 100)
y2 = np.cos(x2)
ax2.plot(x2, y2)

plt.savefig('sin_cos_2.png') # 將視窗另存為png格式圖片附註:np.linspace(0, 4*np.pi, 100):表示在區間[0, 4π]之間取100個點(作為橫座標,“線段是有無數多個點組成的”)。
