1. 程式人生 > >react native 使用echarts做面積圖

react native 使用echarts做面積圖

react native 使用echarts 我用到了一個元件 react-native-secharts
https://github.com/shifeng1993/react-native-secharts
使用

import {Echarts, echarts} from 'react-native-secharts'
 <Echarts ref="echarts1" option={option1} width={screen.width-50} height={240}/>
const option1={
           title : {
             text: '成員當月完成量',
             left:winWidth/3,
             textAlign:'center',
             textStyle:{
                  color:'#0073ff',
                  fontSize:16,
                // fontFamily:'sans-serif'
             }
          },
          tooltip : {
            trigger: 'axis'
           },
          calculable : true,
           xAxis : [
                    {
                        type : 'category',
                        boundaryGap : false,
                        data : ['11/01','11/16','11/30'],
                        axisLine:{
                            lineStyle:{
                                color:'#cccccc'
                            }
                       },
                    //    splitLine: {
                    //      show: false,
                    //      interval: 'auto',
                    //      lineStyle: {
                    //          color: ['#EEEEEE']
                    //      }
                    //    },
                       axisLabel: {
                            margin: 10,
                            textStyle: {
                                color:'#333333',
                                fontSize: 13
                            }
                       }
                    }
                ],
            yAxis : [
                {
                     type : 'value',
                     axisLine:{
                            lineStyle:{
                                color:'#cccccc'
                            }
                       },
                       axisLabel: {
                            margin: 10,
                            textStyle: {
                                color:'#333333',
                                fontSize: 13
                            }
                       },
                      
                 }
             ],
             series : [

                 {
                     name:'完成量',
                     type:'line',
                     smooth:true,
                     itemStyle: {normal: {
                         areaStyle: {color:'#29fff8'},
                         lineStyle:{
                            width:1,
                            color:'#55adf5'
                          },
                          //設定漸變
                        //   areaStyle: {
                        //     normal: {
                        //         color: new echarts.graphic.LinearGradient(0, 0, 0, 1, [{
                        //             offset: 0,
                        //             color: 'rgba(16, 79, 193,1)'
                        //         }, {
                        //             offset: 1,
                        //             color: 'rgba(125, 178, 244,1)'
                        //         }], false)
                        //      }
                        //    },
                        //     itemStyle: {
                        //         normal: {
                        //             color: 'rgba(16, 79, 193,1)'
                        //         }
                        //     },
                      }    
                    },
                     data:[30, 390,   182]   
                 }
             ]       
       }
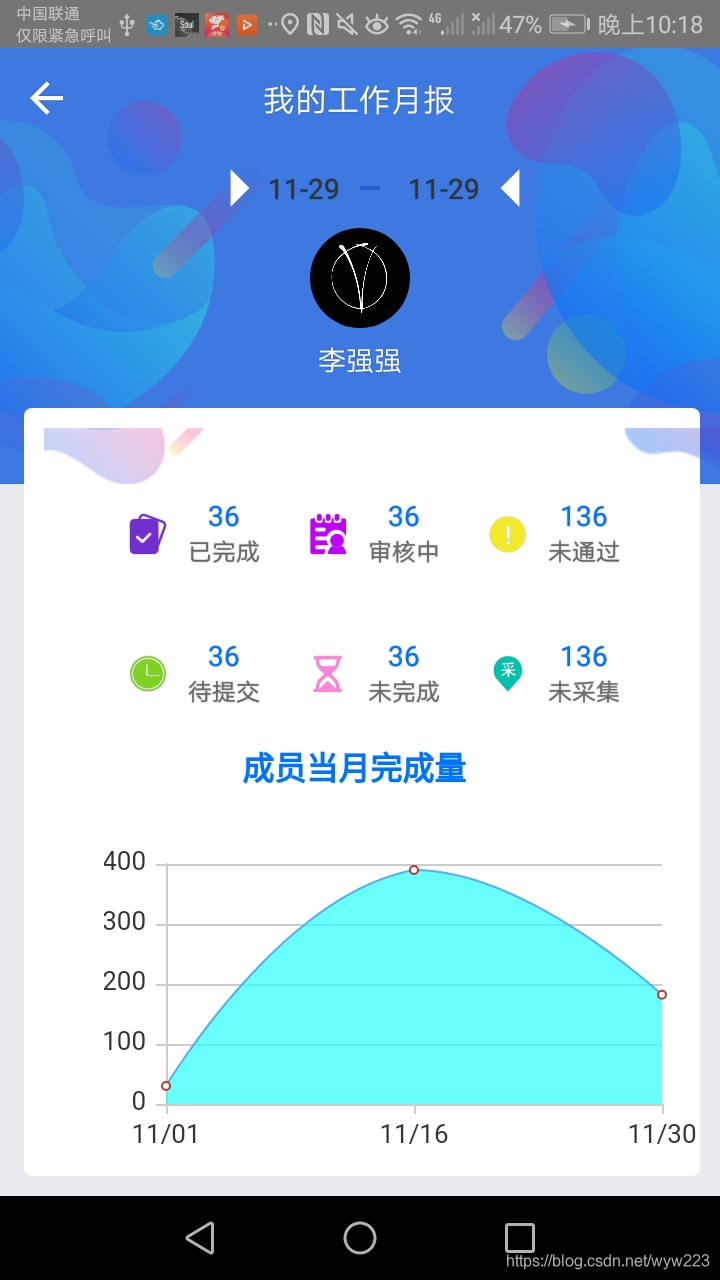
在這裡插入圖片描述