從程式中學習UKF-SLAM(一)
然間從GitHub上發現一個小專案,做的是一個基於UKF的狀態估計,使用C++版本的mathplot做顯示,編譯之後卻發現顯示一直有問題,於是萌生了一個想法:能不能把它移植到ROS中?然後就有了接下來的學習過程,以此記錄。如有問題,歡迎提出。
這是需要複寫的程式碼:在GitHub上(project的核心程式碼是來自原始碼的,如有侵權,請聯絡我更改,謝謝。)
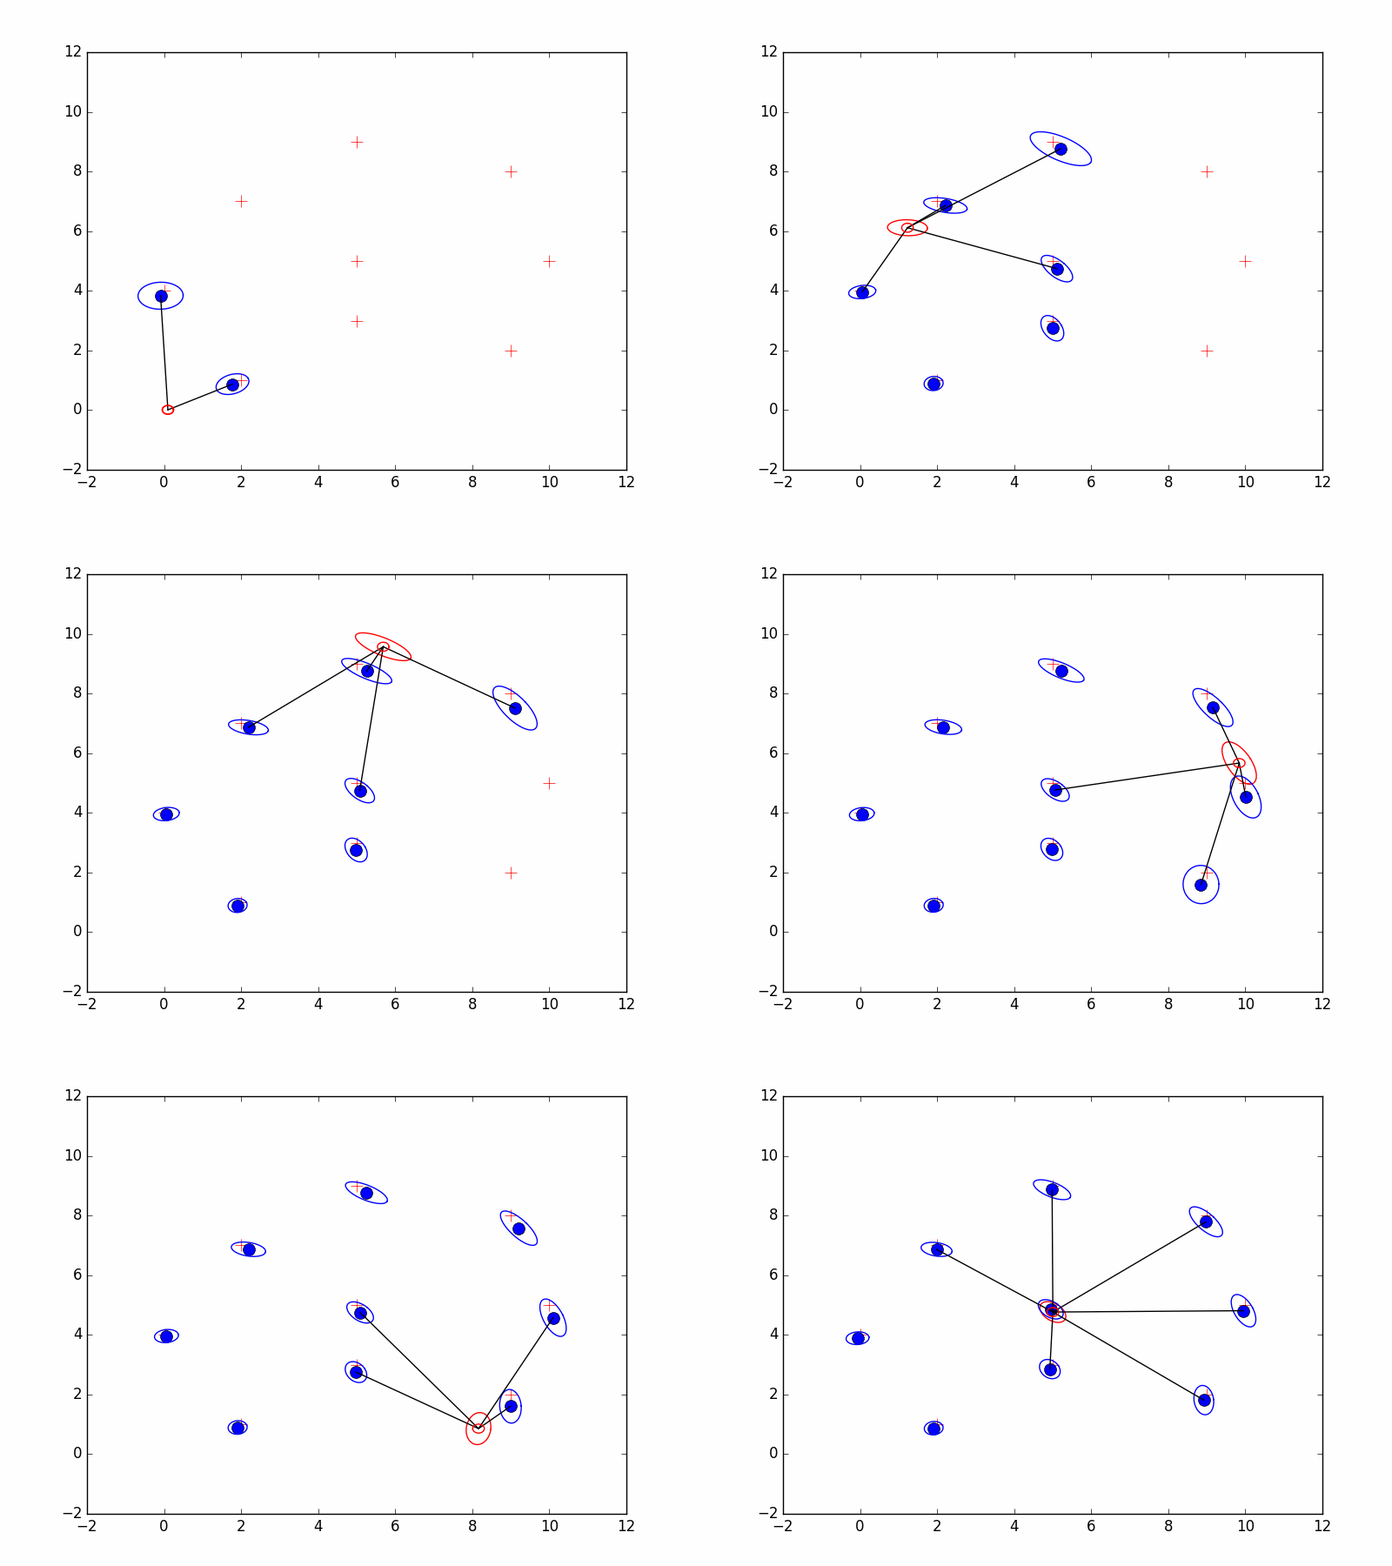
原始碼最終實現的效果如下:

複寫完成的程式碼請看最後一篇部落格。
在ROS中實現的效果如下:百度網盤視訊或者YouTube視訊
一、前提說明
首先解釋一下,路標資料,里程計資料,鐳射資料各自的組成部分,以及project涉及的運動模型。
1.landmark路標
在程式中(在ukf_console.h的51行),用一個vector表示:
std::vector<Eigen::Vector3f> Landmarks;
各表示點的id號,點的x座標以及y座標。此處說明路標具有id標識的,也就決定了後續過程中資料關聯的方式。
在param/world_data.txt中,寫明瞭各個landmark的詳細資訊:
1 2 1
2 0 4
3 2 7
4 9 2
5 10 5
6 9 8
7 5 5
8 5 3
9 5 9
在程式中直接用C++的檔案讀取方法,將landmark資訊讀入vector陣列中:
bool ukf_console::getLandmarks(const std::string& path)
{
	std::ifstream in_file(path, std::ifstream::in);
	if (!in_file.is_open())
	{
		std::cerr << "Cannot open input file: " << (path) << std::endl;
		exit(EXIT_FAILURE);
	}

	std::string line;
	while(std::getline(in_file, line))
	{
		std::istringstream ss(line);
		Eigen::Vector3f mp;
		ss>>mp(0);
		ss>>mp(1);
		ss>>mp(2);
		Landmarks.push_back(mp);
		if (Debug)
			std::cout << (Landmarks.back())(0) << ": " << (Landmarks.back())(1)  << ": " << (Landmarks.back())(2)  << std::endl;
	}

	if (in_file.is_open())
		in_file.close();

}
2.觀測資訊
這裡的觀測資訊包括里程計資訊和鐳射資訊,在tool.h中定義了一組觀測資訊的格式:
struct Record {
		Eigen::Vector3f odom;					//里程計資料: 起點夾角, 行走距離, 終點夾角
		std::vector<Eigen::Vector3f> radar;		//鐳射資料:路標id號, 射線距離, 射線角度
	};
在實際project中,會有多組觀測資訊,所以這裡用一個vector提前儲存了所有資料:
std::vector<Record> Measurements;
首先解釋一下里程計資料的格式,其中的起點夾角和終點夾角是指和,行走距離應該是直線距離。(可能這裡的角度關係還是有點理解不對,,,)

鐳射資料主要是關於landmark的觀測資訊,這裡出了觀測距離ranges和觀測角度,還有路標的特殊id代號。鐳射觀測原理如下

實際的觀測資料由param/sensor_data.txt檔案讀入,某一項資料格式如下:
ODOMETRY 0.100692392654 0.100072845247 0.000171392857486
SENSOR 1 1.89645381418 0.374031885671
SENSOR 2 3.85367751107 1.51951017943
同樣,用C++的檔案讀取方法將資訊讀入vector中:
bool ukf_console::getMeasurements(const std::string& path)
{
	std::ifstream in_file(path, std::ifstream::in);
	if (!in_file.is_open()) {
		std::cerr << "Cannot open input file: " << path << std::endl;
		exit(EXIT_FAILURE);
	}

	std::string line;
	Record record;
	int index = 0;
	while(getline(in_file, line))
	{
		std::string sensor_type;
		std::istringstream ss(line);
		ss >> sensor_type;
		//measurement type r1 t r2
		if (sensor_type.compare("ODOMETRY") == 0)
		{//end the first record;
			if (record.radar.size() != 0)
			{
				Measurements.push_back(record);
				record.radar.clear();
				if (Debug && index < 50)
					std::cout << index << "-----------" << std::endl;
				index++;
			}
			auto& odo = record.odom;
			ss >> odo(0);
			ss >> odo(1);
			ss >> odo(2);
			if (Debug && index < 50)
				std::cout << (record.odom)(0) << ": " << (record.odom)(1) << ": " << (record.odom)(2) << std::endl;
		} else if (sensor_type.compare("SENSOR") == 0)
		{
			auto& radars = record.radar;
			Eigen::Vector3f radarR;
			ss >> radarR(0);
			ss >> radarR(1);
			ss >> radarR(2);
			radars.push_back(radarR);
			if (Debug && index < 50)
				std::cout << (radars.back())(0) << ": " << (radars.back())(1) << ": " << (radars.back())(2) << std::endl;
		}
	}
	if (record.radar.size() != 0)
		Measurements.push_back(record);

	if (in_file.is_open())
		in_file.close();
}
3.運動模型
專案中的小車可以認為是兩輪差動運動模型,如上圖所示,即很容易就能得出下面的執行模型:
在程式(unscented_kf.cpp的90-93)中,這樣實現:
double angle = Xsig(2,i);
Xsig(0, i) = Xsig(0, i) + t * cos(angle + r1);
Xsig(1, i) = Xsig(1, i) + t * sin(angle + r1);
Xsig(2, i) = Xsig(2, i) + r1 + r2;
二、相關Markers的顯示
喜歡使用ROS的一個很重要的原因就是它的視覺化介面了,RVIZ裡的各種marker可以顯示很多豐富的資訊,令程式除錯十分的方便。
1.landmark以及pose的顯示
這裡採用圓柱體進行顯示,直接看landmark的程式碼,estimatePose的不看了:
void ukf_console::LandmarksPublish()
{
	visualization_msgs::MarkerArray ma;
	visualization_msgs::Marker marker;
	// 設定該標記的名稱空間和ID,ID應該是獨一無二的
	// 具有相同名稱空間和ID的標記將會覆蓋前一個
	marker.header.frame_id = "map";
	marker.ns = "2Dlandmarks";
	// 設定標記行為:ADD(添 加),DELETE(刪 除)
	marker.action = visualization_msgs::Marker::ADD;
	// 設定標記型別,初始值為球體。在立方體、球體、箭頭和 圓柱體之間迴圈
	marker.type = visualization_msgs::Marker::CUBE;// 設定初始形狀為圓柱體
	marker.id = 0;

	marker.pose.position.z = 0;
	marker.pose.orientation.x = 0.0;
	marker.pose.orientation.y = 0.0;
	marker.pose.orientation.z = 0.0;
	marker.pose.orientation.w = 1.0;
	// 設定標記的比例,所有方向上尺度1表示1米
	marker.scale.x = marker_scale;
	marker.scale.y = marker_scale;
	marker.scale.z = marker_scale;
	//設定標記顏色,確保alpha(不透明度)值不為0, 紫色
	marker.color.r = 160.0/255.0;
	marker.color.g = 32.0/255.0;
	marker.color.b = 240.0/255.0;
	marker.color.a = 1.0;
	marker.lifetime = ros::Duration(0);

	int markers_size = Landmarks.size();
	for(int i=0 ; i < markers_size ; i++)
	{
		// 設定幀 ID和時間戳
		marker.header.stamp = ros::Time::now();
		marker.id++;
		//設定標記位姿。
		marker.pose.position.x = (Landmarks[i])(1);
		marker.pose.position.y = (Landmarks[i])(2);
		ma.markers.push_back(marker);
	}
	Landmarks_pub.publish(ma);
}
2.觀測資訊顯示
這裡採用的是線段型別LINE_STRIP進行顯示,看程式碼:
void ukf_console::AssociationPublish(const std::vector< Eigen::Vector3f >& radars)
{
	// visualization of the data association
	visualization_msgs::MarkerArray ma;
	visualization_msgs::Marker line_strip;

	line_strip.header.frame_id = "map";
	line_strip.header.stamp = ros::Time::now();

	line_strip.id = 0;
	line_strip.ns = "data_association";
	line_strip.type = visualization_msgs::Marker::LINE_STRIP;
	line_strip.action = visualization_msgs::Marker::ADD;

	line_strip.lifetime = ros::Duration(0.1);
	line_strip.pose.position.x = 0;
	line_strip.pose.position.y = 0;
	line_strip.pose.position.z = 0;
	line_strip.pose.orientation.x = 0.0;
	line_strip.pose.orientation.y = 0.0;
	line_strip.pose.orientation.z = 0.0;
	line_strip.pose.orientation.w = 1.0;
	line_strip.scale.x = marker_scale*0.3;  // line uses only x component
	line_strip.scale.y = marker_scale*0.3;
	line_strip.scale.z = marker_scale*0.3;
	line_strip.color.a = 1.0;
	line_strip.color.r = 255/255;
	line_strip.color.g = 0;
	line_strip.color.b = 0;

	// robot pose
	geometry_msgs::Point pointRobotPose;
	pointRobotPose.x = (ukf_tool->Mu_x)(0);
	pointRobotPose.y = (ukf_tool->Mu_x)(1);
	pointRobotPose.z = 0;

	//draw observation lines
	int visible_num = radars.size();
	for(int i = 0; i < visible_num; i++)
	{
		int index = 0;
		for ( ; index < ukf_tool->LandmarkINmap.size() ; index++)
		{
			if(ukf_tool->LandmarkINmap[index] == (int)(radars[i])(0))
				break;
		}

		line_strip.points.clear();
		line_strip.points.push_back(pointRobotPose);

		geometry_msgs::Point pointLm;
		pointLm.x = ukf_tool->Mu_x(2 * index + 3);
		pointLm.y = ukf_tool->Mu_x(2 * index + 4);
		pointLm.z = 0.0;
		line_strip.points.push_back(pointLm);
		ma.markers.push_back(line_strip);
		line_strip.id++;
	}

	Assoc_pub.publish(ma);
}
3.誤差的顯示
這裡對位姿估計的誤差,landmark估計的誤差都進行了顯示,通常都是採用不確定橢圓進行顯示,這裡也不例外。首先需要對相應的協方差矩陣求解特徵向量和特徵值,在tool.cpp檔案用下面這個函式實現了這樣的功能:
bool tool::computeEllipseOrientationScale2D(Eigen::Matrix2d& eigenvectors, Eigen::Vector2d& eigenvalues, const Eigen::Matrix2d& covariance)
{
	eigenvectors.setZero(2, 2);
	eigenvalues.setIdentity(2, 1);

	Eigen::SelfAdjointEigenSolver<Eigen::Matrix2d> eigensolver(covariance);
	if (eigensolver.info() == Eigen::Success)
	{
		eigenvalues = eigensolver.eigenvalues();
		eigenvectors = eigensolver.eigenvectors();
	}else{
		eigenvalues = Eigen::Vector2d::Zero();  // Setting the scale to zero will hide it on the screen
		eigenvectors = Eigen::Matrix2d::Identity();
		return false;
	}

	// Be sure we have a right-handed orientation system
	makeRightHanded(eigenvectors, eigenvalues);
	return true;
}
另外,為了確保是右手座標系(因為ROS系統中的tf座標系是右手座標系),這裡需要進行一次檢查:
void tool::makeRightHanded(Eigen::Matrix2d& eigenvectors, Eigen::Vector2d& eigenvalues)
{
	Eigen::Vector3d c0;
	c0.setZero();
	c0.head(2) = eigenvectors.col(0);
	c0.normalize();
	Eigen::Vector3d c1;
	c1.setZero();
	c1.head(2) = eigenvectors.col(1);
	c1.normalize();
	Eigen::Vector3d cc = c0.cross(c1);
	if (cc(2) < 0)
	{
		eigenvectors << c1.head(2), c0.head(2);
		double e = eigenvalues(0);
		eigenvalues(0) = eigenvalues(1);
		eigenvalues(1) = e;
	}else
		eigenvectors << c0.head(2), c1.head(2);
}
然後,就可以用協方差矩陣進行不確定性橢圓的繪製了,看程式碼:
void ukf_console::UncertaintyEllipseShow()
{
	visualization_msgs::MarkerArray ma;
	visualization_msgs::Marker marker;
	marker.header.frame_id = "map";
	marker.id = 0;
	marker.ns = "ekf_predict";
	marker.type = visualization_msgs::Marker::SPHERE;
	marker.action = visualization_msgs::Marker::ADD;
	marker.lifetime = ros::Duration(0.5);

	marker.pose.position.z = 0.1;
	marker.color.r = 135/255.0;
	marker.color.g = 206/255.0;
	marker.color.b = 235/255.0;
	marker.color.a = 0.8;//設定標記顏色,確保alpha(不透明度)值為0
	marker.scale.x = marker_scale;
	marker.scale.y = marker_scale;
	marker.scale.z = marker_scale;

	// covariance ellipses
	tf::Quaternion orientation;
	tf::Matrix3x3 tf3d;
	Eigen::Matrix2d eigenvectors;
	Eigen::Vector2d eigenvalues;
	Eigen::Matrix2d covariance;// get the covariance matrix 2x2 for each ellipsoid including robot pose

	// Count the number of landmarks + robot pose
	unsigned int objs_counter = ((ukf_tool->Mu_x.rows())-3 )/2 + 1;
	unsigned int pose_id=0;
	double quantiles=1 ;
	double ellipse_scale_=5;
	for (size_t i = 0; i < objs_counter; i++)
	{
		marker.id++;
		if( i != 0)
			pose_id = i * 2 + 1;

		covariance=ukf_tool->Sigma_y.block(pose_id, pose_id, 2, 2);
		if(tool::computeEllipseOrientationScale2D(eigenvectors, eigenvalues, covariance) == false)
			continue;

		// Rotation matrix around  z axis
		tf3d.setValue(eigenvectors(0, 0), eigenvectors(0, 1), 0, eigenvectors(1, 0), eigenvectors(1, 1), 0, 0, 0, 1);

		// get orientation from rotation matrix
		tf3d.getRotation(orientation);

		marker.pose.position.x = (ukf_tool->Mu_x)(pose_id);
		marker.pose.position.y = (ukf_tool->Mu_x)(pose_id+1);
		marker.pose.position.z = 0;
		marker.pose.orientation.x = orientation.x();
		marker.pose.orientation.y = orientation.y();
		marker.pose.orientation.z = orientation.z();
		marker.pose.orientation.w = orientation.w();
		marker.scale.x = ellipse_scale_ * quantiles * sqrt(eigenvalues(0));
		marker.scale.y = ellipse_scale_ * quantiles * sqrt(eigenvalues(1));
		marker.scale.z = 0.00001;  // Z can't be 0, limitation of ROS
		ma.markers.push_back(marker);
	}

	Uncertainty_pub.publish(ma);
}
三、主迴圈
在結束各項準備工作之後,就可以進入主迴圈了,主迴圈其實也就是兩個工作,預測和更新,非常簡單:
void ukf_console::run()
{
	//read the map data for all landmarks
	getLandmarks(Worlddata_filepath);

	//read the measurements with odometry and radar data
	getMeasurements(Sensordata_filepath);

	LandmarksPublish();

	ukf_tool = new unscented_kf(Landmarks.size());

	ros::Rate rat(10);
	for (const auto& record : Measurements)
	{
		if (!ros::ok())
			break;

		ukf_tool->ProcessMeasurement(record);
		EstimatePosePublish((ukf_tool->Mu_x).head(3));
		AssociationPublish(record.radar);
		UncertaintyEllipseShow();

		rat.sleep();
	}

}
大致思路就是,將觀測資料逐條送入ukf系統,進行ukf估計,觀測結束,也就預示著程式結束了。
下一篇將會重點說說ukf的估計過程,這裡就告一段落了。

