Canvas 實現繪製圖表
阿新 • • 發佈:2018-12-24
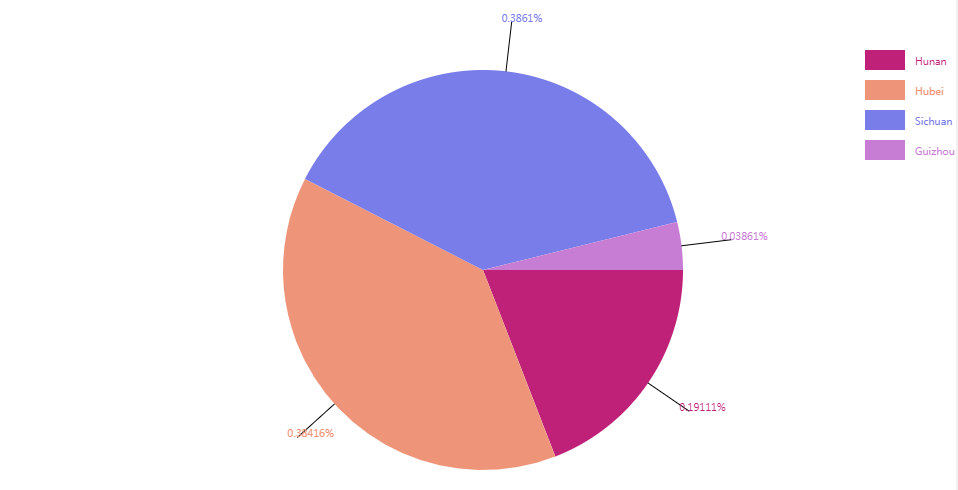
這裡用canvas實現了兩個簡單的圖表,用到了canvas的基本用法,效果如下


新建 chart.js 檔案,封裝繪製方法
構造方法
function myChart(config){ this.width = config.width > 300 ? config.width : 200 //圖表寬度 this.height = config.height > 200 ? config.height : 200 //圖表高度 this.el = config.el //容器DOM元素 this.data = config.data //資料 this.title = config.title //title this.type = config.type //型別 line、pie }
初始化方法
init: function(){ this.canvas = document.createElement('canvas') this.canvas.width = this.width this.canvas.height = this.height document.querySelector(this.el).append(this.canvas) this.ctx = this.canvas.getContext('2d') switch(this.type){ case 'line': this.drawLineChart() break; case 'pie': this.drawPieChart() break; default : this.drawLineChart() break; } },
繪製折線圖
        //繪製折線圖
        drawLineChart: function(){
            var height = this.height
            this.max = 0
            this.min = Infinity
            this.startPoint = { x: 30, y: height - 15 }    //原點位置
            this.innerHieght = this.height - 30 - 15
            this.innerWidth = this.width - 30
            this.findTerminal()
            this.drawCoordinate()
            this.drawLine()
        },
        //找到最大值和最小值
        findTerminal: function(){
            this.data.map((item, index) => {
                this.max = item.val > this.max ? item.val : this.max
                this.min = item.val < this.min ? item.val : this.min
            })
        },
        //繪製座標軸
        drawCoordinate: function(){
            //繪製座標軸
            this.ctx.clearRect(0, 0, this.width, this.height)
            this.ctx.beginPath()
            this.ctx.moveTo(this.startPoint.x, this.startPoint.y)
            this.ctx.lineTo(this.startPoint.x, this.startPoint.y - this.innerHieght)
            this.ctx.moveTo(this.startPoint.x, this.startPoint.y)
            this.ctx.lineTo(this.startPoint.x + this.innerWidth, this.startPoint.y)
            this.ctx.stroke()
            //繪製橫向標尺
            var distance = Math.floor(this.innerWidth / this.data.length)
            this.ctx.beginPath()
            this.ctx.strokeStyle = "#999"
            for(let i = 0; i < this.data.length; i++){
                let curX = this.startPoint.x + distance*i
                this.ctx.moveTo(curX , this.startPoint.y)
                this.ctx.lineTo(curX , this.startPoint.y - 5)
                this.ctx.moveTo(curX , this.startPoint.y + 15)
                this.ctx.textAlign = "center"
                this.ctx.fillText(this.data[i]['key'] , curX , this.startPoint.y + 15 )
            }
            this.ctx.stroke()
            //繪製橫向座標
            var unit = Math.floor((this.max - this.min) / 20)
            this.ctx.beginPath()
            this.ctx.strokeStyle = "#999"
            for(let y = 0; y < 20; y++){
                let curY = Math.floor(this.startPoint.y - this.innerHieght / 20 * y)
                let curVal = Math.floor(this.min + unit*y)
                this.ctx.moveTo(this.startPoint.x, curY)
                this.ctx.lineTo(this.startPoint.x + 5, curY)
                this.ctx.moveTo(this.startPoint.x - 30, curY)
                this.ctx.fillText(curVal, this.startPoint.x - 15 , curY + 3 )
            }
            this.ctx.stroke()
            //繪製title
            this.ctx.beginPath()
            this.ctx.font = "20px Arial"
            this.ctx.fillText(this.title, this.width / 2 - 30 , 20)
            this.ctx.stroke()
        },
        //繪製折線
        drawLine: function(){
            var distance = Math.floor(this.innerWidth / this.data.length)
            this.ctx.beginPath()
            this.ctx.moveTo(this.startPoint.x, this.startPoint.y)
            for(let i = 0; i < this.data.length; i++){
                let curY = this.startPoint.y - (((this.data[i].val - this.min)/(this.max - this.min)) * this.innerHieght)
                this.ctx.lineTo(this.startPoint.x + i*distance, curY)
                this.ctx.strokeStyle = "#000"
                this.ctx.font = "10px Arial"
                this.ctx.fillText(Math.floor(this.data[i].val), this.startPoint.x + i*distance, curY + 10 )
                this.ctx.stroke()
                this.ctx.beginPath()
                this.ctx.fillStyle="gray"
                this.ctx.arc(this.startPoint.x + i*distance, curY,3,0,2*Math.PI);
                this.ctx.fill()
                this.ctx.beginPath()
                this.ctx.moveTo(this.startPoint.x + i*distance, curY)
            }
        }
繪製餅狀圖
        //繪製餅狀圖
        drawPieChart: function(){
            var shortAxis = this.width < this.height ? this.width : this.height
            this.radius = 0.4 * shortAxis
            var width = this.width
            var height = this.height
            this.centerPoint = { x: width/2, y: height/2 + 20}
            this.drawPieLegend()
            this.calcPercentage()
            this.drawPie()
        },
        //計算餅狀圖比例
        calcPercentage: function(){
            var total = 0
            this.data.map((item,index) => {
                total += item.val
            })
            this.data.map((item,index) => {
                item.proportion = Math.floor(item.val / total * 100000) / 100000
            })
        },
        //繪製餅狀圖內容
        drawPie: function(){
            var offset = 0
            for(let i = 0; i < this.data.length; i++){
                this.ctx.beginPath()
                this.ctx.moveTo(this.centerPoint.x, this.centerPoint.y)
                this.ctx.arc(this.centerPoint.x, this.centerPoint.y, this.radius, 2*Math.PI*offset, 2*Math.PI*(this.data[i].proportion + offset))
                this.ctx.closePath()
                this.ctx.fillStyle = this.data[i].bg
                this.ctx.fill()
                this.ctx.beginPath()
                let x = this.centerPoint.x + Math.cos(2*Math.PI*(this.data[i].proportion/2 + offset))*this.radius
                let y = this.centerPoint.y + Math.sin(2*Math.PI*(this.data[i].proportion/2 + offset))*this.radius
                this.ctx.moveTo(x, y)
                let x1 = this.centerPoint.x + Math.cos(2*Math.PI*(this.data[i].proportion/2 + offset))*(this.radius + 50)
                let y1 = this.centerPoint.y + Math.sin(2*Math.PI*(this.data[i].proportion/2 + offset))*(this.radius + 50)
                this.ctx.lineTo(x1, y1)
                this.ctx.stroke()
                this.ctx.fillText(this.data[i].proportion + '%', x1 - 10, y1)
                offset += this.data[i].proportion
            }
        },
        //繪製餅狀圖圖例
        drawPieLegend: function(){
            for(let i = 0; i < this.data.length; i++){
                let color = '#'+Math.floor(Math.random()*0xffffff).toString(16)
                this.data[i].bg = color
                this.ctx.fillStyle = color
                this.ctx.fillRect(this.width - 100, 30 * i + 50, 40, 20)
                this.ctx.fillText(this.data[i].key, this.width - 50 , 30 * i + 65)
            }
        },
使用:
引入 chart.js 檔案
<script type="text/javascript" src="chart.js"></script>
    var chart = new myChart({
        width: document.body.clientWidth,
        height: 500,
        el: '#app',
        data: arr,
        title: `${data.name}(${data.symbol})`,
        type: 'line'
    })
    chart.init()
