Spring Cloud【Finchley】-10Hystrix監控
阿新 • • 發佈:2018-12-27
文章目錄
概述
Hystrix除了提供容錯外,還提供了功能近乎實時的監控。HystrixCommand和HystrixObservableCommand在執行時,會生成執行結果和執行指標。
監控Hystrix
Hystrix的hystrix-metrics-event-stream模組 將監控資訊以text/event-stream的格式暴露給外部系統。新增 spring-cloud-starter-netflix-hystrix依賴後,我們看下pom的依賴關係,如下圖,可以知道 spring-cloud-starter-netflix-hystrix已經包含了該模組。
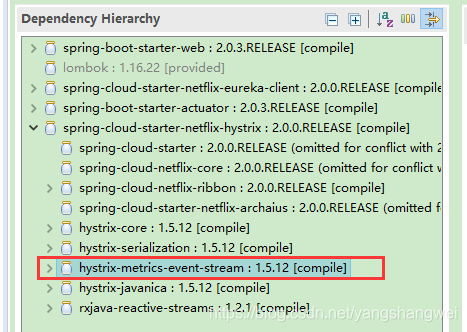
這樣的話,只需要新增spring-boot-starter-actuator即可,就可以使用 /actuator/hystrix.stream端點來獲取Hystrix的監控資訊了。
步驟
我們用 上一篇 Spring Cloud【Finchley】-08使用Hystrix實現容錯
Step1 新增spring-cloud-starter-netflix-hystrix依賴
- spring-cloud-starter-netflix-hystrix(包含了hystrix-metrics-event-stream)
Step2 新增spring-boot-starter-actuator依賴
- spring-boot-starter-actuator
Step3 application.yml開啟監控端點
- application.yml 中 配置資訊開啟了所有的監控端點
#actuator  啟用所有的監控端點 “*”號代表啟用所有的監控端點,可以單獨啟用,例如,health,info,metrics
#  spring boot 升為 2.0 後,為了安全,預設 Actuator 只暴露了2個端點,heath 和 info,繼續
# 訪問  http://192.168.1.103:7902/actuator/metrics
management:
  endpoints:
    web:
      exposure:
        include: "*"
  endpoint:
      health:
        show-details: ALWAYS
Step4 測試
- 啟動microservice-discovery-eureka,註冊中心
- 啟動micorservice-provider-user,服務提供者
- 啟動micorservice-consumer-movie-ribbon-hystrix,服務消費者,整合了Hystrix , 埠 7902
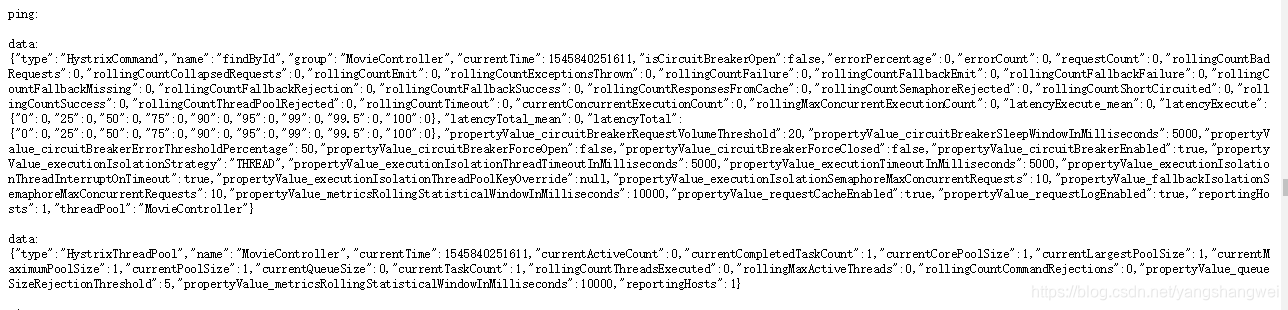
- 訪問 http://localhost:7902/actuator/hystrix.stream ,如下

一直處於ping 請求狀態,是因為micorservice-consumer-movie-ribbon-hystrix中註解了@HystrixCommand的方法還未被執行,沒有產生監控資料,
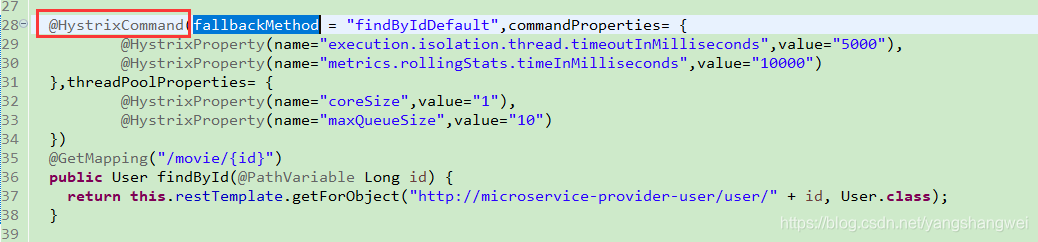
- 訪問@HystrixCommand註解標註的方法 ,請求 http://localhost:7902/movie/4 ,重新去 http://localhost:7902/actuator/hystrix.stream 觀察下,如下
重複出現類似的內容,是因為系統會不斷的重新整理以便可以獲取實時的監控資料,包括HystrixCommand的名稱、group名稱、斷路器名稱、錯誤率、錯誤數等