
一個簡單的效能計數器:CodeTimer
有資料,有真相,相信大家在平時的工作或學習過程中,都需要比較幾種不同方法或實現之間的效能差距。在這些時候,往往就需要我們不斷地建立Stopwatch,開啟,關閉,然後列印時間。這種一遍又一遍的重複終有一天會讓人忍無可忍,因此如果能有一個“標準”的效能計數器,那應該可以讓生活輕鬆許多。這個效能計數器不用複雜,夠用就好;也不需要考慮擴充套件性,要擴充套件時直接修改程式碼就夠了;同樣不需要考慮輸出格式,直接列印在Console就行。
在上次的.NET技術大會中,Jeffrey Richter大叔在Keynote Session中進行了一個名為“The Performance of Everyday Things”的主題演講,展示了各種常用程式設計元素之間的效能對比。在演示中他使用了一個名為CodeTimer的簡單計數器,用於統計每種做法的效能。可惜翻遍了每個地方都沒發現JR大叔在哪裡公開了這個計數器的實現。算了,那麼就憑著印象寫一個出來吧,反正也不復雜。
總的來說,CodeTimer有兩個公開方法,一個是Initialize,一個是Time:
public static class CodeTimer { public static void Initialize() { Process.GetCurrentProcess().PriorityClass = ProcessPriorityClass.High; Thread.CurrentThread.Priority = ThreadPriority.Highest; Time("", 1, () => { }); } public static voidTime(string name, int iteration, Action action) { ... } }
CodeTimer.Initialize方法應該在測試開始前呼叫。首先它會把當前程序及當前執行緒的優先順序設為最高,這樣便可以相對減少作業系統在排程上造成的干擾。然後呼叫一次Time方法進行“預熱”,讓JIT將IL編譯成原生代碼,讓Time方法儘快“進入狀態”。Time方法則是真正用於效能計數的方法,實現如下:
public static void Time(string name, int iteration, Action action) { if(String.IsNullOrEmpty(name)) return; // 1. ConsoleColor currentForeColor = Console.ForegroundColor; Console.ForegroundColor = ConsoleColor.Yellow; Console.WriteLine(name); // 2. GC.Collect(GC.MaxGeneration, GCCollectionMode.Forced); int[] gcCounts = new int[GC.MaxGeneration + 1]; for (int i = 0; i <= GC.MaxGeneration; i++) { gcCounts[i] = GC.CollectionCount(i); } // 3. Stopwatch watch = new Stopwatch(); watch.Start(); ulong cycleCount = GetCycleCount(); for (int i = 0; i < iteration; i++) action(); ulong cpuCycles = GetCycleCount() - cycleCount; watch.Stop(); // 4. Console.ForegroundColor = currentForeColor; Console.WriteLine("\tTime Elapsed:\t" + watch.ElapsedMilliseconds.ToString("N0") + "ms"); Console.WriteLine("\tCPU Cycles:\t" + cpuCycles.ToString("N0")); // 5. for (int i = 0; i <= GC.MaxGeneration; i++) { int count = GC.CollectionCount(i) - gcCounts[i]; Console.WriteLine("\tGen " + i + ": \t\t" + count); } Console.WriteLine(); } private static ulong GetCycleCount() { ulong cycleCount = 0; QueryThreadCycleTime(GetCurrentThread(), ref cycleCount); return cycleCount; } [DllImport("kernel32.dll")] [return: MarshalAs(UnmanagedType.Bool)] static extern bool QueryThreadCycleTime(IntPtr threadHandle, ref ulong cycleTime); [DllImport("kernel32.dll")] static extern IntPtr GetCurrentThread();
Time方法接受三個引數,名稱,迴圈次數以及需要執行的方法體。打印出花費時間,消耗的CPU時鐘週期,以及各代垃圾收集的回收次數。具體實現分幾個步驟,如下:
- 保留當前控制檯前景色,並使用黃色輸出名稱引數。
- 強制GC進行收集,並記錄目前各代已經收集的次數。
- 執行程式碼,記錄下消耗的時間及CPU時鐘週期1。
- 恢復控制檯預設前景色,並打印出消耗時間及CPU時鐘週期。
- 列印執行過程中各代垃圾收集回收次數。
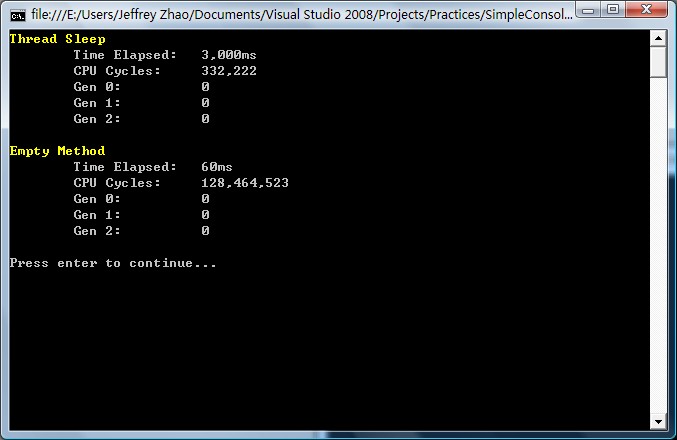
與傳統計數方法相比,這段程式碼還輸出了更多資訊:CPU時鐘週期及各代垃圾收集回收次數。CPU時鐘週期是效能計數中的輔助參考,說明CPU分配了多少時間片給這段方法來執行,它和消耗時間並沒有必然聯絡。例如Thread.Sleep方法會讓CPU暫時停止對當前執行緒的“供給”,這樣雖然消耗了時間,但是節省了CPU時鐘週期:
CodeTimer.Time("Thread Sleep", 1, () => { Thread.Sleep(3000); });
CodeTimer.Time("Empty Method", 10000000, () => { });
結果如下:
而垃圾收集次數的統計,即直觀地反應了方法資源分配(消耗)的規模:
int iteration = 100 * 1000;

string s = "";
CodeTimer.Time("String Concat", iteration, () => { s += "a"; });

StringBuilder sb = new StringBuilder();
CodeTimer.Time("StringBuilder", iteration, () => { sb.Append("a"); });
結果如下:

老趙最近在研究一個問題的幾種不同做法在效能上的優劣,其中CodeTimer起到了很重要的作用——這邊也先賣個關子,接下來老趙也將會寫幾篇文章來講解這個問題。
注1:統計CPU時鐘週期時使用P/Invoke訪問QueryThreadCycleTime函式,這是Vista和Server 2008中新的函式。感謝裝配腦袋在這裡提供的幫助。
注2:對於.NET 2.0及Vista以下作業系統,請參考《對老趙寫的簡單效能計數器的修改》