
R語言--統計--PCA
阿新 • • 發佈:2018-12-28
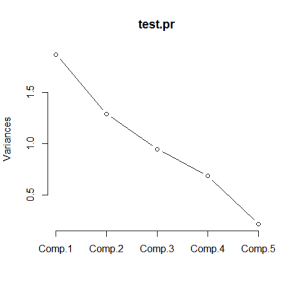
test<-data.frame(
x1=c(150,142,164,160,189,132,220,167,176,120,169,122,154,247,180,220,176,157,160,138 ),
x2=c(30,28,30,32,35,36,38,34,31,33,40,50,34,46,36,37,37,32,40,33),
x3=c(70,59,50,62,40,56,56,60,74,56,50,52,64,50,80,54,54,52,54,90),
x4=c(90,60,101,37,58,200,33,40,40,50,50,61,75,50,70,90,60,230,100,110),
x5=c(156,140,93,110,155,101,101,125,200,251,11,12,13,14,15,16,17,18,19,20)
)

test.pr<-princomp(test,cor=TRUE)

summary(test.pr,loadings=TRUE)

screeplot(test.pr,type="lines")

p <- predict(test.pr)

biplot(test.pr)
現在的理解不過,等以後填坑.......