資料科學和人工智慧技術筆記 八、特徵選擇
阿新 • • 發佈:2018-12-28
八、特徵選擇
作者:Chris Albon
譯者:飛龍
用於特徵選取的 ANOVA F 值
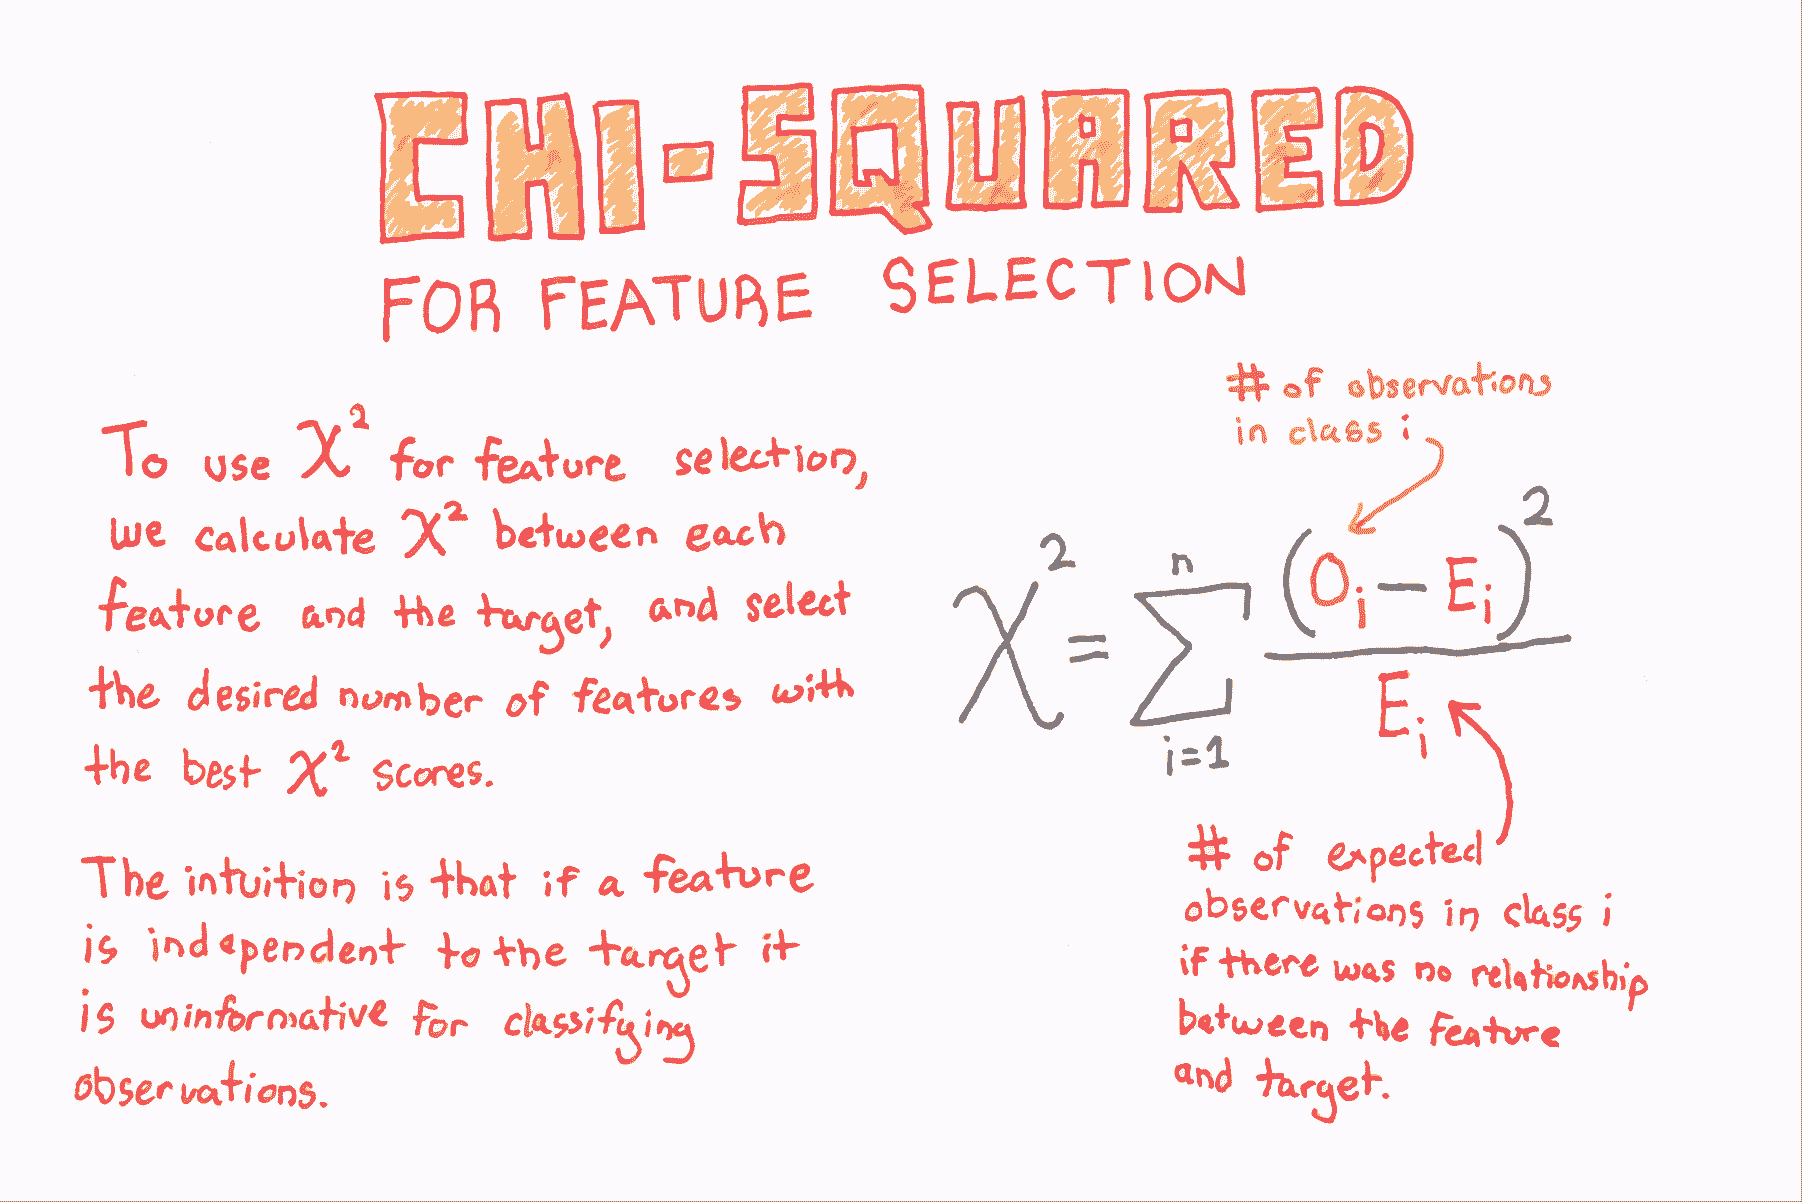
如果特徵是類別的,計算每個特徵與目標向量之間的卡方( )統計量。 但是,如果特徵是定量的,則計算每個特徵與目標向量之間的 ANOVA F 值。
F 值得分檢查當我們按照目標向量對數字特徵進行分組時,每個組的均值是否顯著不同。
# 載入庫
from sklearn.datasets import load_iris
from sklearn.feature_selection import SelectKBest
from sklearn.feature_selection import f_classif
# 載入鳶尾花資料
iris = load_iris()
# 建立特徵和標籤
X = iris.data
y = iris.target
# 建立 SelectKBest 物件來選擇兩個帶有最佳 ANOVA F 值的特徵 用於特徵選擇的卡方

# 載入庫
from sklearn.datasets import load_iris
from sklearn.feature_selection import SelectKBest
from sklearn.feature_selection import chi2

# 載入鳶尾花資料
iris = load_iris()

# 建立特徵和目標
X = iris.data
y = iris.target

# 通過將資料轉換為整數,轉換為類別資料
X = X.astype(int)

# 選擇兩個卡方統計量最高的特徵
chi2_selector = SelectKBest(chi2, k=2)
X_kbest = chi2_selector.fit_transform(X, y)

# 展示結果
print('Original number of features:', X.shape[1])
print('Reduced number of features:', X_kbest.shape[1])

'''
Original number of features: 4
Reduced number of features: 2
'''
丟棄高度相關的特徵
# 載入庫
import pandas as pd
import numpy as np

# 建立特徵矩陣,具有兩個高度相關特徵
X = np.array([[1, 1, 1],
              [2, 2, 0],
              [3, 3, 1],
              [4, 4, 0],
              [5, 5, 1],
              [6, 6, 0],
              [7, 7, 1],
              [8, 7, 0],
              [9, 7, 1]])

# 將特徵矩陣轉換為 DataFrame
df = pd.DataFrame(X)

# 檢視資料幀
df
| 0 | 1 | 2 | |
|---|---|---|---|
| 0 | 1 | 1 | 1 |
| 1 | 2 | 2 | 0 |
| 2 | 3 | 3 | 1 |
| 3 | 4 | 4 | 0 |
| 4 | 5 | 5 | 1 |
| 5 | 6 | 6 | 0 |
| 6 | 7 | 7 | 1 |
| 7 | 8 | 7 | 0 |
| 8 | 9 | 7 | 1 |
# 建立相關度矩陣
corr_matrix = df.corr().abs()

# 選擇相關度矩陣的上三角
upper = corr_matrix.where(np.triu(np.ones(corr_matrix.shape), k=1).astype(np.bool))

# 尋找相關度大於 0.95 的特徵列的索引
to_drop = [column for column in upper.columns if any(upper[column] > 0.95)]

# 丟棄特徵
df.drop(df.columns[to_drop], axis=1)
| 0 | 2 | |
|---|---|---|
| 0 | 1 | 1 |
| 1 | 2 | 0 |
| 2 | 3 | 1 |
| 3 | 4 | 0 |
| 4 | 5 | 1 |
| 5 | 6 | 0 |
| 6 | 7 | 1 |
| 7 | 8 | 0 |
| 8 | 9 | 1 |
遞迴特徵消除
# 載入庫
from sklearn.datasets import make_regression
from sklearn.feature_selection import RFECV
from sklearn import datasets, linear_model
import warnings

# 消除煩人但無害的警告
warnings.filterwarnings(action="ignore", module="scipy", message="^internal gelsd")

# 生成特徵矩陣,目標向量和真實相關度
X, y = make_regression(n_samples = 10000,
                       n_features = 100,
                       n_informative = 2,
                       random_state = 1)

# 建立線性迴歸
ols = linear_model.LinearRegression()

# 建立遞迴特徵消除器,按照 MSE 對特徵評分
rfecv = RFECV(estimator=ols, step=1, scoring='neg_mean_squared_error')

# 擬合遞迴特徵消除器
rfecv.fit(X, y)

# 遞迴特徵消除
rfecv.transform(X)

'''
array([[ 0.00850799,  0.7031277 , -1.2416911 , -0.25651883, -0.10738769],
       [-1.07500204,  2.56148527,  0.5540926 , -0.72602474, -0.91773159],
       [ 1.37940721, -1.77039484, -0.59609275,  0.51485979, -1.17442094],
       ...,
       [-0.80331656, -1.60648007,  0.37195763,  0.78006511, -0.20756972],
       [ 0.39508844, -1.34564911, -0.9639982 ,  1.7983361 , -0.61308782],
       [-0.55383035,  0.82880112,  0.24597833, -1.71411248,  0.3816852 ]])
'''

# 最佳特徵數量
rfecv.n_features_

# 5
方差閾值二元特徵
from sklearn.feature_selection import VarianceThreshold

# 建立特徵矩陣:
# 特徵 0:80% 的類 0
# 特徵 1:80% 的類 1
# 特徵 2:60% 的類 0,40% 的類 1
X = [[0, 1, 0],
     [0, 1, 1],
     [0, 1, 0],
     [0, 1, 1],
     [1, 0, 0]]
在二元特徵(即伯努利隨機變數)中,方差計算如下:
其中 是類 1 觀測的比例。 因此,通過設定 ,我們可以刪除絕大多數觀察是類 1 的特徵。
# Run threshold by variance
thresholder = VarianceThreshold(threshold=(.75 * (1 - .75)))
thresholder.fit_transform(X)

'''
array([[0],
       [1],
       [0],
       [1],
       [0]])
'''
用於特徵選擇的方差閾值

from sklearn import datasets
from sklearn.feature_selection import VarianceThreshold

# 載入鳶尾花資料
iris = datasets.load_iris()

# 建立特徵和目標
X = iris.data
y = iris.target

# 使用方差閾值 0.5 建立 VarianceThreshold 物件
thresholder = VarianceThreshold(threshold=.5)

# 應用方差閾值
X_high_variance = thresholder.fit_transform(X)

# 檢視方差大於閾值的前五行
X_high_variance[0:5]

'''
array([[ 5.1,  1.4,  0.2],
       [ 4.9,  1.4,  0.2],
       [ 4.7,  1.3,  0.2],
       [ 4.6,  1.5,  0.2],
       [ 5\. ,  1.4,  0.2]])
'''
